Authors: Robert Bryce
Power Hungry (23 page)
CHAPTER 14
The United States Lags in Energy Efficiency
Y
OU'VE HEARD IT a thousand times: The United States wastes energy. Americans are energy hogs. Our cars are too big. Our houses are too big. And, of course, our collective butts are too big, too.
OU'VE HEARD IT a thousand times: The United States wastes energy. Americans are energy hogs. Our cars are too big. Our houses are too big. And, of course, our collective butts are too big, too.
Aside from the last one, which can likely be verified with a tape measure, those claims are largely wrong. Over the past three decades or so, the United States has been as good asâor better thanânearly every other developed country on Earth at improving its energy efficiency. It has been among the best at reducing its carbon intensity, its energy intensity, and its per-capita energy use. And here's the most important thing to remember when considering those facts: The United States has achieved these reductions without participating in the Kyoto Protocol (which would have set targets for reductions in carbon emissions) or creating an emissions trading system like the one employed in Europe. In fact, the United States has been better than nearly every other country on the planet at reducing its carbon intensity and its energy use without doing any of the things that environmental groups and renewable energy lobbyists contend are essential.
Nevertheless, Americans are being steamrolled with claims that the United States is a laggardâand Congress has latched on to the idea. In 2007, it passed the Energy Independence and Security Act, a 310-page bill in which the word “efficiency” appears 331 times and “efficient” appears
111 times.
1
In 2009, the original version of the cap-and-trade bill (also known as Waxman-Markey or the American Clean Energy and Security Act of 2009) contained the word “efficiency” 218 times and the word “efficient” 44 times.
2
Environmental groups such as the Sierra Club, Greenpeace, and the Environmental Defense Fund, repeatedly say that America's first priority on energy policy should be greater efficiency. For decades, Amory Lovins, the Colorado-based energy pundit, has been claiming that efficiency is the essential solution to all of America's energy challenges.
Though nearly everyone is convinced that the United States is lagging on energy efficiency, the numbers, as usual, tell a different story.
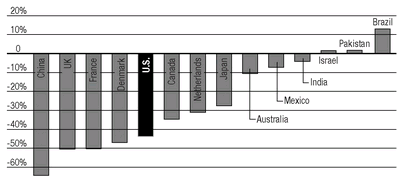
Let's look first at the carbon intensity of the U.S. economyâthat is, the amount of carbon dioxide per unit of economic output, measured in metric tons of carbon dioxide per $1,000 of GDP. Between 1980 and 2006, U.S. carbon intensity fell by 43.6 percent. That's far better than the performance of the EU-15, which managed a reduction of 30.1 percent over that same time period. The U.S. reduction in carbon intensity over that period nearly matched that of Western European countries that are often held up as models of aggressive national energy policy implementation, namely, Denmark and France, which managed to reduce their carbon intensity by 47 percent and 50.2 percent, respectively. Somewhat surprising is the performance of China, which, thanks to improvements in the efficiency of its machinery, reduced its carbon intensity by 64 percent.
3
3
The United States is reducing its carbon intensity because it continues to become more efficient in how it uses energy. Despite bingeing on SUVs and ever-faster cars with ever-increasing numbers of cupholders and seat heaters, the United States has become far more efficient in how it consumes oil and natural gas. And that efficiency is occurring in myriad ways, from more efficient cars to better home furnaces and more efficient power plants that are able to wring more electricity out of a molecule of natural gas.
Now let's consider energy intensity. (Note that carbon intensity and energy intensity, while closely related, are not the same thing. A given country may have greater carbon intensity than its neighbors if it relies more heavily on coal. Conversely, it may have lower carbon intensity if it
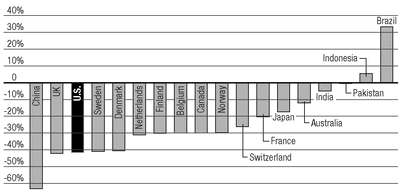
relies more heavily on nuclear power or hydropower.) Between 1980 and 2006, America's energy intensityâthe amount of energy needed to produce $1 of gross domestic product (GDP)âfell by about 42 percent. Among the major countries of the world only one did better: China, where energy intensity fell by 63 percent. Over that same time period, Britain matched the United States, seeing its energy intensity fall 42 percent. The reduction in U.S. energy intensity is particularly notable given that it bested countries such as France and Japan, which saw their energy intensities decline by 20.4 percent and 17.4 percent, respectively. Meanwhile, in some developing countries, energy intensity actually increased. For instance, in Indonesia, the amount of energy needed to produce $1 of GDP increased by 5.4 percent, and in Brazil, energy intensity increased by 33.3 percent.
4
FIGURE 21
Change in Carbon Intensity of Major World Economies, 1980 to 2006
Change in Carbon Intensity of Major World Economies, 1980 to 2006

Source
: Energy Information Administration, “World Carbon IntensityâWorld Carbon Dioxide Emissions from the Consumption and Flaring of Fossil Fuels Per Thousand Dollars of Gross Domestic Product Using Market Exchange Rates, 1980â2006,”
http://www.eia.doe.gov/pub/international/iealf/tableh1gco2.xls
.
: Energy Information Administration, “World Carbon IntensityâWorld Carbon Dioxide Emissions from the Consumption and Flaring of Fossil Fuels Per Thousand Dollars of Gross Domestic Product Using Market Exchange Rates, 1980â2006,”
http://www.eia.doe.gov/pub/international/iealf/tableh1gco2.xls
.
The decline in U.S. energy intensity becomes even more interesting when you consider that between 1980 and 2006, the U.S. GDP more than doubled, going from $5.8 trillion to about $12.9 trillion.
5
(Those figures are in constant year 2005 dollars.)
6
Furthermore during that same period the U.S. population increased by about 31.5 percent, going from about 228 million people to about 300 million.
7
Put another way, between 1980 and 2006, the U.S. economy grew by 122 percent, its population
grew by 31.5 percent, and yet the total amount of energy needed to produce $1 of GDP fell by about 42 percent. Why did that happen? Much of it can be explained simply by the fact that consumers, engineers, and entrepreneurs are always working to do things more efficiently, not because it is better for the environment, necessarily, but because it saves them money and increases profits. In other words, it's just good business.
FIGURE 22
Change in Energy Intensity of Major World Economies, 1980 to 2006
Change in Energy Intensity of Major World Economies, 1980 to 2006

Source
: Energy Information Administration, “World Energy IntensityâTotal Primary Energy Consumption Per Dollar of Gross Domestic Product Using Purchasing Power Parities, 1980â2006,”
http://www.eia.doe.gov/pub/international/iealf/tablee1p.xls
.
: Energy Information Administration, “World Energy IntensityâTotal Primary Energy Consumption Per Dollar of Gross Domestic Product Using Purchasing Power Parities, 1980â2006,”
http://www.eia.doe.gov/pub/international/iealf/tablee1p.xls
.
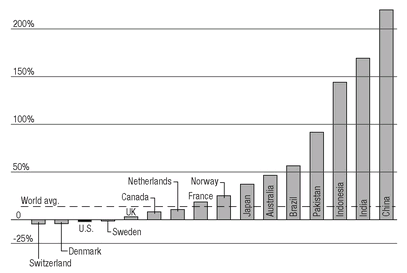
Now let's look at one of the most important energy metrics: per-capita energy consumption. From 1980 through 2006, the average per-capita energy consumption in the United States fell by 2.5 percent. That decline was greater than in any other developed country in the world except for Switzerland and Denmark, which saw their per-capita energy use fall by 4.3 percent and 4.2 percent, respectively.
8
During that same time period, per-capita energy use in major European countries rose significantly. For instance, per-capita energy use in France rose by 18.8 percent. Spain's per-capita energy use jumped by 93.4 percent, and Norway's increased by 25.1 percent. (Britain's per-capita energy use increased by 3 percent.) During that same time period, the world average for per-capita energy use rose by 13.7 percent.
9
While it's true that the United States uses significantly more energy on a per-capita basis than the rest of the world (334.6 million Btu in
2006 versus a world average of 72.4 million Btu), that difference is largely a function of America's higher standard of living as well as the much greater distances that Americans have to travel. For instance, the state of Texas sprawls over an area covering some 268,000 square miles.
10
That means it's bigger than France, the largest country in Western Europe, which encompasses 220,000 square miles.
11
Or consider the area displaced by everyone's favorite banker and chocolatier: Switzerland, which covers less than 16,000 square miles.
12
Though few people would swap Zurich for Enid, you could fit four Switzerlands inside Oklahoma's friendly confines and still have enough space left over to squeeze in Puerto Rico.
13
FIGURE 23
Change in Per-Capita Energy Use, Major World Economies, 1980 to 2006
Change in Per-Capita Energy Use, Major World Economies, 1980 to 2006

Source
: Energy Information Administration, “World Per Capita Total Primary Energy Consumption, 1980â2006,” revised December 19, 2008,
http://www.eia.doe.gov/pub/international/iealf/tablee1c.xls
.
: Energy Information Administration, “World Per Capita Total Primary Energy Consumption, 1980â2006,” revised December 19, 2008,
http://www.eia.doe.gov/pub/international/iealf/tablee1c.xls
.
So what's going on? Why is America doing so well on these measures of carbon intensity, energy intensity, and per-capita energy use?
There are several answers to those questions. Among the most important is that the U.S. economy has moved toward more service-based production. It may be lamentable for some people, but significant segments
of America's heavy industry have moved overseas where labor and raw materials are cheaper. Energy-intensive businesses such as steel making, aluminum smelting, and auto manufacturing have become far more globalized than before, and that has resulted in the loss of factory jobs to China, Mexico, the Middle East, and other countries that have certain advantages, such as lower labor costs or cheaper energy.
of America's heavy industry have moved overseas where labor and raw materials are cheaper. Energy-intensive businesses such as steel making, aluminum smelting, and auto manufacturing have become far more globalized than before, and that has resulted in the loss of factory jobs to China, Mexico, the Middle East, and other countries that have certain advantages, such as lower labor costs or cheaper energy.
Another key factor: Engineers keep doing what they do best, making products that are faster, cheaper, and produce more horsepower, more efficiently, than the ones they made the year before. Modern refrigerators use far less energy than the ones that were made back in the 1970s and 1980s. Modern personal computers use processors that are far more powerful and efficient than the ones made just three or four years ago. The proliferation of programmable thermostats has allowed consumers to better manage the cooling and heating of their homes. The integration of microchips into automobiles has helped to make modern cars faster, more luxurious, and more powerful while allowing them to achieve better fuel economy than the ones produced thirty years ago. Modern longhaul trucks are more efficient thanks to better aerodynamics and engines. The same is true of modern jet airplanes.
Similar trends are discernible in America's oil consumption. In 1973, there were about 130 million registered vehicles in the United States and Americans were driving about 1.3 trillion miles per year.
14
That year, the United States was using 17.3 million barrels of oil per day.
15
By 2007, the United States had 254 million motor vehicles on the road and they were being driven 2.9 trillion miles per year.
16
Thus, between 1973 and 2007, the number of miles driven in the United States increased by 123 percent, but the amount of oil needed to do that driving had increased by just 20 percent, to 20.7 million barrels per day.
17
The relatively small increase in oil consumption since 1973 is a product of several factors. Cars, trucks, and airplanes are becoming more efficient, and the United States has become smarter about its oil consumption. Back in 1973, nearly 17 percent of the electricity produced in the United States was generated with oil. By 2008, that number had fallen to 1.1 percent.
18
18
Other books
The Midnight Dress by Karen Foxlee
JF04 - The Carnival Master by Craig Russell
Playing at Forever by Michelle Brewer
A Lady of Talent by Evelyn Richardson
His Captive Princess by Sandra Jones
His Taste of Temptation: In the Line of Duty, Book 3 by Cathryn Fox
Night Fury: First Act by Belle Aurora
A Great Game by Stephen J. Harper
