Understanding Business Accounting For Dummies, 2nd Edition (77 page)
Read Understanding Business Accounting For Dummies, 2nd Edition Online
Authors: Colin Barrow,John A. Tracy
Tags: #Finance, #Business

Suppose that you and your managers, with the assistance of your accounting staff, have analysed your fixed operating expenses line by line for the coming year. Some of these fixed expenses will actually be reduced or eliminated next year. But the large majority of these costs will continue next year, and most are subject to inflation. Based on careful studies and estimates, you and your staff forecast that your total fixed operating expenses for next year will be £6,006,000 (including £835,000 depreciation expense, compared with the £780,000 depreciation expense for last year).
Thus, you will need to earn £8,862,000 total contribution margin next year:
£2,856,000 EBIT goal (£2,600,000 last year plus £256,000 budgeted increase)
+ 6,006,000
Budgeted fixed operating expenses next year
£8,862,000 Total contribution margin goal next year
This is your main profit budget goal for next year, assuming that fixed operating expenses are kept in line. Fortunately, your volume-driven variable operating expenses should not increase next year. These are mainly transportation costs, and the shipping industry is in a very competitive ‘hold-the-price-down' mode of operations that should last through the coming year. The cost per unit shipped should not increase, but if you sell and ship more units next year, the expense will increase in proportion.
You have decided to hold the revenue-driven operating expenses at 8 per cent of sales revenue during the coming year, the same as for the year just ended. These are sales commissions, and you have already announced to your sales staff that their sales commission percentage will remain the same during the coming year. On the other hand, your purchasing manager has told you to plan on a 4 per cent product cost increase next year - from £550 per unit to £572 per unit, or an increase of £22 per unit. Thus, your unit contribution margin would drop from £320 to £298 (if the other factors that determine margin remain the same).
One way to attempt to achieve your total contribution margin objective next year is to load all the needed increase on sales volume and keep sales price the same. (We're not suggesting that this strategy is a good one, but it's a good point of departure.) At the lower unit contribution margin, your sales volume next year would have to be 29,738 units:
£8,862,000 total contribution margin goal ÷ £298 contribution margin per unit = 29,738 units sales volume
Compared with last year's 26,000 units sales volume, you would have to increase your sales by over 14 per cent. This may not be feasible.
After discussing this scenario with your sales manager, you conclude that sales volume cannot be increased 14 per cent. You'll have to raise the sales price to provide part of the needed increase in total contribution margin and to offset the increase in product cost. After much discussion, you and your sales manager decide to increase the sales price by 3 per cent. Based on the 3 per cent sales price increase and the 4 per cent product cost increase, your unit contribution margin next year is determined as follows:
Unit Contribution Margin Next Year
Sales price £1,030.00
Less: Product cost 572.00
Less: Revenue-driven operating expenses 82.40
Less: Volume-driven variable operating expenses
50.00
Equals: Contribution margin per unit £325.60
At this £325.60 budgeted contribution margin per unit, you determine the total sales volume needed next year to reach your profit goal as follows:
£8,862,000 total contribution margin goal next year ÷ £325.60 contribution margin per unit = 27,217 units sales volume
This sales volume is about 5 per cent higher than last year (1,217 additional units over the 26,000 sales volume last year = about 5 per cent increase).
If you don't raise the sales price, your division has to increase sales volume by 14 per cent (as calculated above). If you increase the sales price by just 3 per cent, the sales volume increase you need to achieve your profit goal next year is only 5 per cent. Does this make sense? Well, this is just one of many alternative strategies for next year. Perhaps you could increase sales price by 4 per cent. But, you know that most of your customers are sensitive to a sales price increase, and your competitors may not follow with their own sales price increase.
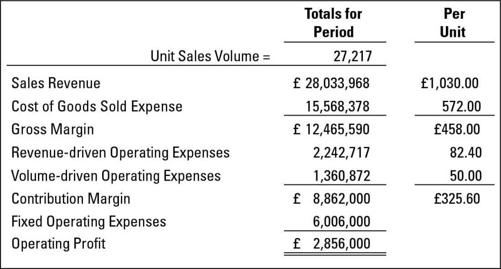
After lengthy consultation with your sales manager, you finally decide to go with the 3 per cent sales price increase combined with the 5 per cent sales volume growth as your official budget strategy. Accordingly, you forward your budgeted management profit and loss account to the CEO. Figure 10-2 summarises this profit budget for the coming year. This summary-level budgeted management profit and loss account is supplemented with appropriate schedules to provide additional detail about sales by types of customers and other relevant information. Also, your annual profit plan is broken down into quarters (perhaps months) to provide benchmarks for comparing actual performance during the year against your budgeted targets and timetable.
Figure 10-2:
Budgeted profit and loss account for coming year.
Budgeting cash flow from profit for the coming year
The budgeted profit plan (refer to Figure 10-2) is the main focus of attention, but the CEO also requests that all divisions present a
budgeted cash flow from profit
for the coming year.
Remember:
The profit you're responsible for as general manager of the division is earnings before interest and tax (EBIT) - not net income after interest and tax.
Chapter 7 explains that increases in debtors, stock, and prepaid expenses
hurt
cash flow from profit and that increases in creditors and accrued liabilities
help
cash flow from profit. You should compare your budgeted management profit and loss account for the coming year (Figure 10-2) with your actual statement for last year (Figure 10-1). This side-by-side comparison (not shown here) reveals that sales revenue and all expenses are higher next year.
Therefore, your short-term operating assets, as well as the liabilities that are driven by operating expenses, will increase at the higher sales revenue and expense levels next year - unless you can implement changes to prevent the increases.
For example, sales revenue increases from £26,000,000 last year to the budgeted £28,033,968 for next year - an increase of £2,033,968. Your debtors balance was five weeks of annual sales last year. Do you plan to tighten up the credit terms offered to customers next year - a year in which you will raise the sales price and also plan to increase sales volume? We doubt it. More likely, you will keep your debtors balance at five weeks of annual sales. Assume that you decide to offer your customers the same credit terms next year. Thus, the increase in sales revenue will cause debtors to increase by £195,574 (5⁄52 × £2,033,968 sales revenue increase).
Last year, stock was 13 weeks of annual cost of goods sold expense. You may be in the process of implementing stock reduction techniques
.
If you really expect to reduce the average time stock will be held in stock before being sold, you should inform your accounting staff so that they can include this key change in the balance sheet and cash flow models. Otherwise, they will assume that the past ratios for these vital connections will continue next year.
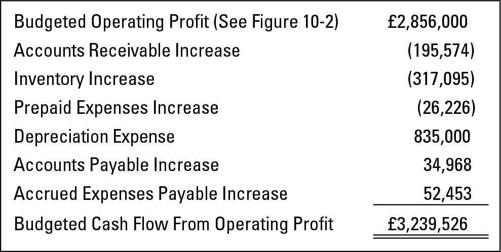
Figure 10-3 presents a summary of your budgeted cash flow from profit (the EBIT for your division) based on the information given for this example and using the ratios explained in Chapter 7 for short-term operating assets and liabilities. For example, debtors increases by £195,574, as just explained. And, stock increases by £317,095 (13⁄52 × £1,268,378 cost of goods sold expense increase).
Note:
Increases in accrued interest payable and income tax payable are not included in your budgeted cash flow. Your profit responsibility ends at the operating profit line, or earnings before interest and income tax expenses.
Figure 10-3:
Budgeted cash flow from profit statement for coming year.

Business budgeting versus government budgeting: Only the name is the same
Business and government budgeting are more different than alike. Government budgeting is preoccupied with allocating scarce resources among many competing demands. From national agencies down to local education authorities, government entities have only so much revenue available. They have to make very difficult choices regarding how to spend their limited tax revenue.
Formal budgeting is legally required for almost all government entities. First, a budget request is submitted. After money is appropriated, the budget document becomes legally binding on the government agency. Government budgets are legal straitjackets; the government entity has to stay within the amounts appropriated for each expenditure category. Any changes from the established budgets need formal approval and are difficult to get through the system.
A business is not legally required to use budgeting. A business can use its budget as it pleases and can even abandon its budget in midstream. Unlike the government, the revenue of a business is not constrained; a business can do many things to increase sales revenue. In short, a business has much more flexibility in its budgeting. Both business and government should apply the general principle of cost/benefits analysis to make sure that they are getting the best value for money. But a business can pass its costs to its customers in the sales prices it charges. In contrast, government has to raise taxes to spend more.

