Read Why aren’t we Saving the Planet: A Psycholotist’s Perspective Online
Authors: Geoffrey Beattie
Tags: #Behavioral Sciences
Why aren’t we Saving the Planet: A Psycholotist’s Perspective (14 page)

So the question becomes: what proportion of time do participants fixate on the carbon footprint information on each of the products, compared to each of the other categories of information represented on the same products? This is on the understanding that this measure of visual attention (with the fovea being directed at each information category)
reflects the amount of processing of each of the different categories of information with clear implications for consumer behaviour and the efficacy of the carbon footprint approach for combating climate change.
Of course, the answer to this question won’t solely depend on the design or aesthetics of the product. Since the 1940s with the ‘New Look’ approach to perception, it has been clear that perception is an active and constructive process that often operates in a top-down fashion. Often critical are the needs and values of the perceiver. In a well-known study, Bruner and Goodman (1947) asked children from different socio-economic groups to estimate the size of coins by adjusting the diameter of a beam of light. Children from poorer backgrounds overestimated the size of the coins compared to richer children because, according to the authors of the paper, poorer children place higher value on such coins than richer children and this impacts on their basic processes of perception. This overestimation happens unconsciously and is outside the individuals’ awareness or control (see also Balcetis and Dunning 2006; Greenwald 1992). So the fact that many people hold positive implicit attitudes to low carbon footprints may well impact on their patterns of visual attention to the products. As Bowman, Su, Wyble and Barnard (2009) wrote: ‘Humans have an impressive capacity to determine what is salient in their environment and direct attention in a timely fashion to such items.’ Carbon labelling
should
be salient to participants in this experiment; the question is how impressive is their capacity to direct their visual attention at the carbon footprint information, in the context of competing information about price, nutritional content, value, usage, etc.
Three products were used (see
Figures 7.1
–7.6): a Tesco low-energy light bulb (part of the ‘Greener Living’ range), Tesco’s ‘Non-Bio’ liquid detergent and Tesco’s own-brand freshly squeezed orange juice. These were photographed on a flat matt background with the bulb’s front and back in a single shot as one image (front of bulb to the right, back of bulb to the left – view 1; front to the left, back to the right – view 2, in order to control for natural biases in patterns of left–right looking), the orange juice front and side as one
image (front to the right – view 1; front to the left – view 2) and the detergent’s front and back as one image (front to the right – view 1; front to the left – view 2).
These images were shown in slide-show format on a Dell desktop computer monitor to ten participants with a 10-second exposure time for each slide (participants were merely told ‘to look at the images’). We set up an ASL Model 504 remote eye tracker in the laboratory, in front of the computer monitor on which the stimulus material was to be shown. The eye tracker employs a camera surrounded by infrared emitting diodes to illuminate the eye of the participant looking at a screen. The participant’s point of gaze on the screen is determined by the camera combining the position of the pupil and the corneal reflection. The remote camera in the eye tracker fed into a screen for the experimenter’s observation of the positioning of camera observing the eye. From a separate computer, the experimenter was able to adjust the illumination of the infrared camera and the ‘pan/tilt’ of the camera in the eye tracker to enable recognition of the pupil and corneal reflection.
The recordings were analysed using Irfan View and each 40 ms frame was manually coded in terms of participants looking at each of the possible information categories represented on the products or packaging. There were 10 participants × 6 slides × 10 seconds × 25 frames, providing something like 15,000 individual data points which were individually coded and analysed. Examples of the individual frames in the analysis are outlined in
Figure 7.7
Visual attention in the first 5 seconds and the second 5 seconds were analysed separately. A third analysis focused on the first fixation of each participant on each slide. A fixation was defined as the eyes remaining still for a minimum of 200 ms – in other words, for five frames or more (see Rayner 1998:373). In the analysis of the first fixation of each participant, the exact duration of the fixation was also analysed. The scoring of each individual frame with respect to the informational categories was highly reliable.
Now for the details of what we found. In the case of the light bulb, considerable visual attention was directed at the carbon footprint icon in the first 10 seconds (a mean of
82.5 intervals of gaze directed at the icon; in other words participants looked at the carbon footprint icon for a mean of 3.3 out of 10 seconds). This was by far the commonest focus for visual attention in this time period. The second commonest focus was the accompanying carbon footprint information (printed above and below the actual icon), and this competed most closely with other information about the energy backers of the product (EDF energy) and the fact that this product came from the ‘Greener Living’ range. The information that the bulb lasted for 6 years was also a common focus of visual attention. In other words, in the case of the light bulb much of the visual attention seemed to focus on ‘green’ aspects of the product (see
Figure 7.8
).
When these 10-second periods of visual attention were broken down into the first and second 5 seconds, some interesting differences started to emerge. Although the carbon footprint icon was looked at for a mean of 40.0 intervals in the first 5 seconds, and 42.5 in the second 5 seconds (thus showing a remarkable degree of consistency), this was not the case with the accompanying information about carbon footprint. This information was only looked at for 8.7 intervals in the first 5 seconds and 39.5 in the second 5-second period. This showed the most striking divergence in any of the information categories examined. In terms of the first 5 seconds, after the carbon footprint icon, the most frequently looked-at category was the EDF energy label followed by the ‘Greener Living’ label. It appears, therefore, that in the case of the low-energy light bulb, participants were primed to seek information relative to green issues and they did this more or less within the time frame that they would normally have in supermarkets for viewing products in making their consumer choices (see
Figure 7.9
).
In the case of the orange juice, the main attentional focus in the first 10 seconds was on the information that the oranges were picked and processed within 24 hours (a mean of 79.8 intervals), followed by the product image (a mean of 64.2 intervals). The third major focus of attention in the case of the orange juice was the price (this ranking excludes the category ‘other’, which is the residual category). The focus on the carbon footprint icon was lower down the list (a mean

Figure 7.8
Number of (40 ms) intervals with gaze directed at each category, for the first 10 seconds of viewing: (top) light bulb, front; (bottom) light bulb, back.
of 33.1 intervals), but was still higher than the attentional focus on the nutritional information (a mean of 27.3 intervals). The accompanying information about carbon footprint was lower down again, competing in terms of attentional focus with things like ‘not from concentrate’ and the reminder of the price on the side view of the juice packaging (see
Figure 7.10
).
Looking separately at the attentional focus for the first 5 seconds and the second 5 seconds, again some interesting differences emerged (see
Figure 7.11
). Unlike the low-energy
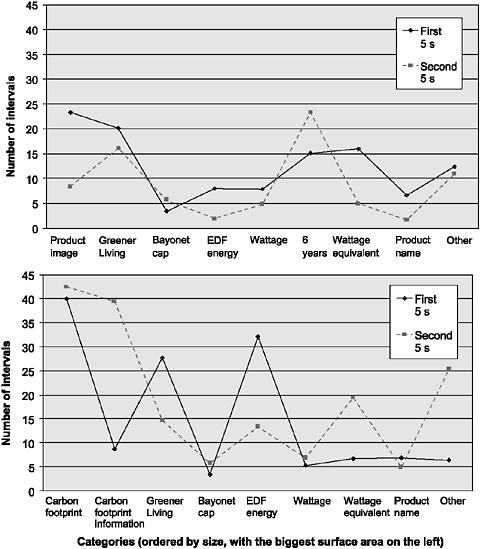
Figure 7.9
Number of (40 ms) intervals with gaze directed at each category, for the first and second 5 seconds of viewing: (top) light bulb, front; (bottom) light bulb, back.
light bulb, the carbon footprint icon was typically not fixated for very long in the first 5 seconds, but was only really fixated in the second 5 seconds; indeed, the amount of fixation in the second 5 seconds increased by a factor of 3. However, the accompanying information about carbon footprint did not go up nearly as steeply between the first and the second 5-second intervals. Nutritional information was hardly focused on at all in the first 5 seconds (a mean of 5.8 intervals), representing just over 1/5 of a second of actual
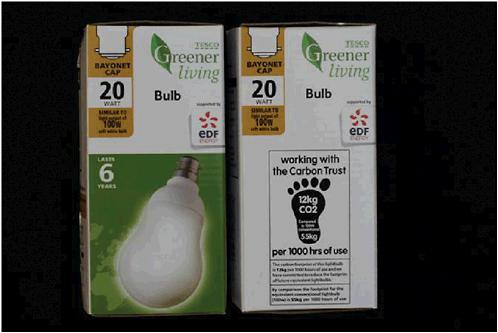
Figure 7.1
Light bulb: view 1.
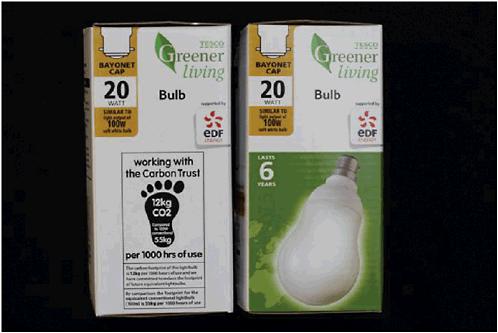
Figure 7.2
Light bulb: view 2.
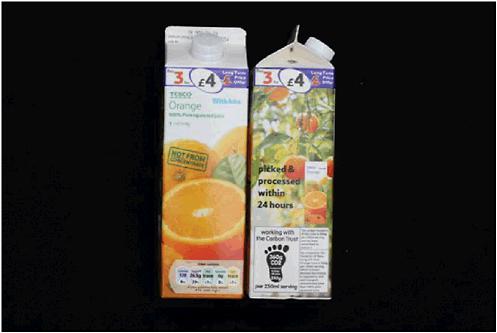
Figure 7.3
Orange juice: view 1.