Data Mining (48 page)
Authors: Mehmed Kantardzic

5.9 REVIEW QUESTIONS AND PROBLEMS
1.
What are the differences between statistical testing and estimation as basic areas in statistical inference theory?
2.
A data set for analysis includes only one attribute X:
X = {7, 12, 5, 18, 5, 9, 13, 12, 19, 7, 12, 12, 13, 3, 4, 5, 13, 8, 7, 6}.
(a)
What is the mean of the data set X?
(b)
What is the median?
(c)
What is the mode, and what is the modality of the data set X?
(d)
Find the standard deviation for X.
(e)
Give a graphical summarization of the data set X using a boxplot representation.
(f)
Find outliers in the data set X. Discuss the results.
3.
For the training set given in Table
5.1
, predict the classification of the following samples using simple Bayesian classifier.
(a)
{2, 1, 1}
(b)
{0, 1, 1}
4.
Given a data set with two dimensions X and Y:
| X | Y |
| 1 | 5 |
| 4 | 2.75 |
| 3 | 3 |
| 5 | 2.5 |
(a)
Use a linear regression method to calculate the parameters α and β where y = α + β x.
(b)
Estimate the quality of the model obtained in (a) using the correlation coefficient r.
(c)
Use an appropriate nonlinear transformation (one of those represented in Table
5.3
) to improve regression results. What is the equation for a new, improved, and nonlinear model? Discuss a reduction of the correlation coefficient value.
5.
A logit function, obtained through logistic regression, has the form:

Find the probability of output values 0 and 1 for the following samples:
(a)
{ 1, −1, −1 }
(b)
{ −1, 1, 0 }
(c)
{ 0, 0, 0 }
6.
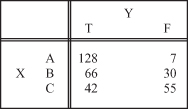
Analyze the dependency between categorical attributes X and Y if the data set is summarized in a 2 × 3 contingency table:

7.
Implement the algorithm for a boxplot representation of each numeric attribute in an input flat file.
8.
What are the basic principles in the construction of a discriminant function applied in an LDA?
9.
Implement the algorithm to analyze a dependency between categorical variables using two-dimensional contingency tables.
10.
Find
EMA
(4, 4) for the data set {27, 27, 18, 9} if: (a) p = 1/3, and (b) p = 3/4. Discuss the solutions.
11.
With Bayes classifier, missing data items are
(a)
treated as equal compares
(b)
treated as unequal compares
(c)
replaced with a default value
(d)
ignored
Determine what is the true statement.
12.
The table below contains counts and ratios for a set of data instances to be used for supervised Bayesian learning. The output attribute is sex with possible values
male
and
female.
Consider an individual who has said
no
to the life insurance promotion,
yes
to the magazine promotion,
yes
to the watch promotion, and has credit card insurance. Use the values in the table together with Bayes classifier to determine the probability that this individual is
male.

13.
The probability that a person owns a sports car given that they subscribe to at least one automotive magazine is 40%. We also know that 3% of the adult population subscribes to at least one automotive magazine. Finally, the probability of a person owning a sports car given that they do not subscribe to at least one automotive magazine is 30%. Use this information together with Bayes theorem to compute the probability that a person subscribes to at least one automotive magazine given that they own a sports car.
14.
Suppose the fraction of undergraduate students who smoke is 15% and the fraction of graduate students who smoke is 23%. If one-fifth of the college students are graduate students and the rest are undergraduates, what is the probability that a student who smokes is a graduate student?
15.
Given a 2 × 2 contingency table for X and Y attributes:

(a)
Find a contingency table with
expected values.
(b)
If the threshold value for χ
2
test is 8.28, determine if attributes X and Y are dependent or not.
16.
The logit function, obtained through logistic regression, has a form:

Find the probability of output values 0 and 1 for the sample {1, −1, −1}.
17.
Given:
- P(Good Movie | Includes Tom Cruise) = 0.01
- P(Good Movie | Tom Cruise absent) = 0.1
- P(Tom Cruise in a randomly chosen movie) = 0.01
What is P(Tom Cruise is in the movie | Not a Good Movie)?
18.
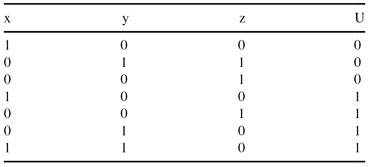
You have the following training set with three Boolean input x, y, and z, and a Boolean output U. Suppose you have to predict U using a naive Bayesian classifier.

(a)
After learning is complete what would be the predicted probability P(U = 0|x = 0, y = 1, z = 0)?
(b)
Using the probabilities obtained during the Bayesian classifier training, what would be the predicted probability P(U = 0|x = 0)?
5.10 REFERENCES FOR FURTHER STUDY
Berthold, M., D. J. Hand, eds.,
Intelligent Data Analysis—An Introduction
, Springer, Berlin, 1999.
The book is a detailed introductory presentation of the key classes of intelligent data-analysis methods including all common data-mining techniques. The first half of the book is devoted to the discussion of classical statistical issues, ranging from basic concepts of probability and inference to advanced multivariate analyses and Bayesian methods. The second part of the book covers theoretical explanations of data-mining techniques with their roots in disciplines other than statistics. Numerous illustrations and examples will enhance a reader’s knowledge about the theory and practical evaluations of data-mining techniques.
Brandt, S.,
Data Analysis: Statistical and Computational Methods for Scientists and Engineers
, 3rd edition, Springer, New York, 1999.
This text bridges the gap between statistical theory and practice. It emphasizes concise but rigorous mathematics while retaining the focus on applications. After introducing probability and random variables, the book turns to the generation of random numbers and important distributions. Subsequent chapters discuss statistical samples, the maximum-likelihood method, and the testing of statistical hypotheses. The text concludes with a detailed discussion of several important statistical methods such as least-square minimization, ANOVA, regressions, and analysis of time series.
Cherkassky, V., F. Mulier,
Learning from Data: Concepts, Theory and Methods
, John Wiley, New York, 1998.
The book provides a unified treatment of the principles and methods for learning dependencies from data. It establishes a general conceptual framework in which various learning methods from statistics, machine learning, and other disciplines can be applied—showing that a few fundamental principles underlie most new methods being proposed today. An additional strength of this primary theoretical book is a large number of case studies and examples that simplify and make understandable statistical learning theory concepts.
Hand, D., Mannila H., Smith P.,
Principles of Data Mining
, MIT Press, Cambridge, MA, 2001.
The book consists of three sections. The first, foundations, provides a tutorial overview of the principles underlying data-mining algorithms and their applications. The second section, data-mining algorithms, shows how algorithms are constructed to solve specific problems in a principled manner. The third section shows how all of the preceding analyses fit together when applied to real-world data-mining problems.