Read Frozen Earth: The Once and Future Story of Ice Ages Online
Authors: Doug Macdougall
Tags: #Science & Math, #Biological Sciences, #Paleontology, #Earth Sciences, #Climatology, #Geology, #Rivers, #Environment, #Weather, #Nature & Ecology, #Oceans & Seas, #Oceanography, #Professional & Technical, #Professional Science
Frozen Earth: The Once and Future Story of Ice Ages (21 page)

The book did attract considerable interest among meteorologists, because it was a departure from the traditional empirical approach to temperature and weather.
For those who were willing to consider it seriously, it provided a theoretical framework for understanding meteorological observations.
But in spite of the fact that it contained calculations of surface temperatures back to 130,000 years before the present, the book did not at first have much of an impact among geologists.
A mathematical theory of temperature variations seemed remote from their immediate concerns.
In fact, more attention was paid to Milankovitch’s results for temperatures on Mars than to those for the Earth (he had carried out calculations for Venus, Mars, and the moon, in addition to the Earth).
For several decades, the popular press had been full of stories of “canals” and sentient life on Mars, but Milankovitch’s calculations predicted temperatures on the red planet far too low for liquid water or any life to exist.
Eventually, however, geologists and others interested in the Earth’s climate history, especially its ice ages, came to realize the importance of Milankovitch’s work.
That appreciation arose through another of those serendipitous circumstances that are common in science and history.
One of the meteorologists who read Milankovitch’s book and was much impressed by his theoretical approach was the prominent German scientist Wladimir Köppen, who immediately saw the relevance of the calculations for understanding climate changes.
It so happened that Köppen’s daughter had married the geophysicist and arctic explorer Alfred Wegener, best known today as the first person to propose a comprehensive theory of continental drift.
When Köppen read Milankovitch’s book, he and Wegener were in the process of preparing
a book manuscript on the subject of past climates.
Köppen noticed that there was a direct correspondence between the timing of glaciation in the Alps (as far as it was then known) and the Northern Hemisphere temperatures calculated by Milankovitch.
He immediately wrote to Milankovitch asking if he would be willing to collaborate with him and Wegener.
Thus began a long association, which lasted until Köppen’s death in 1940 and ensured that Milankovitch’s calculations would be taken seriously.
It was a fortunate and productive collaboration, because Milankovitch had the mathematical tools, Köppen had the international stature that guaranteed widespread attention to their ideas, and between them Wegener and Köppen had a good understanding of the geological evidence for ice ages.
Milankovitch’s theory attempted to show how temperatures on the Earth would fluctuate over time in response to astronomical parameters.
Like Croll before him, he considered the eccentricity of the Earth’s orbit around the sun, and the wobble of its rotational axis, but he also introduced a new factor—he showed that the
amount
of tilt of the rotation axis is a far more important factor than had previously been believed.
The angle of tilt doesn’t change very much—it varies through a total range of only about two degrees, from roughly one degree less to one degree more than today’s 23.5 degrees—but it markedly affects the contrast between winter and summer temperatures.
This is not difficult to understand if you think about it.
When the tilt is greater, the sun rises later and sets earlier in the winter hemisphere, and the converse is true for the summer hemisphere.
So compared to the present, the summer hemisphere is heated more, the winter hemisphere less.
Like the other astronomical parameters, changes in the amount of tilt are regular— they go through a complete cycle every 41,000 years.
Milankovitch’s work also revealed another aspect of the solar radiation effects that had not been realized previously.
Because he made calculations for a range of latitudes rather than just for the Northern and Southern Hemispheres, as had been done before, he discovered that the various astronomical factors have quite different effects at different latitudes.
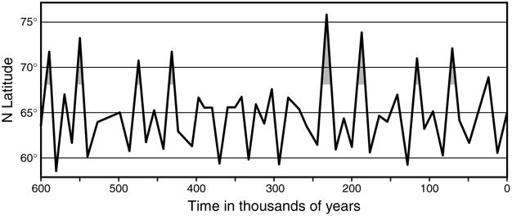
Figure 14.
The graph that Milutin Milankovitch sent to Wladimir Köppen shows the “equivalent latitude” for 65° N in summer, based on the amount of solar energy received, for the past 600,000 years.
Milankovitch believed that glacial intervals would occur at times when the equivalent latitude was significantly higher than today, indicated by the shaded peaks on this graph.
Köppen was especially interested in these nuances in Milankovitch’s calculations.
He argued that low summer temperatures in northern regions were the most critical factor for initiating permanent ice cover in Europe and North America—if summers were cool, more of the winter snow would persist without melting, the additional snow cover would cause more sunlight to be reflected back into space, and temperatures would drop further as a result, eventually leading to widespread glaciation.
This was a radical departure from the conventional wisdom, the exact opposite of what most workers up to this time—including Croll and many of his supporters—had assumed: that cold winters were the key to the start of glaciation.
According to Milankovitch’s calculations, the same orbital conditions that produced cool summers resulted in winters that were slightly warmer than normal.
But this did not bother Köppen—the higher winter temperatures would promote evaporation, and the temperatures would still be low enough that the resulting increased precipitation would fall as snow on the growing ice sheets.
In his book, Milankovitch had calculated temperatures at various latitudes on Earth through the past 130,000 years.
However, all the
evidence then available indicated that the Pleistocene Ice Age with its multiple glacial advances and retreats stretched back much farther in time than this.
Köppen asked if Milankovitch could extend the calculations to at least 600,000 years before the present so that they could make a detailed comparison between theory and the field evidence.
It would not be necessary, he said, to do the calculations for every latitude.
He suggested restricting attention to the swath between 55° and 65° north latitude, since that was the region from which much of the detailed evidence for glaciation had been gathered.
Today, scientific results are frequently reported with the aid of elaborate, colorful graphs.
Even in the 1920s, especially for interdisciplinary work, it was important to think about how the results would be presented.
Milankovitch’s calculations would result in tables of numbers that showed the amount of heat received from the sun at various latitudes.
Tables could convey the information, but they would not have the immediate impact of a visual representation.
Köppen and Milankovitch discussed the problem at length, finally deciding that a graph showing the changes over time would be best.
That would illustrate for the reader both the magnitude of the variations, and exactly when the coldest and warmest intervals had occurred.
When he had finished his calculations, Milankovitch sent Köppen graphs showing the amount of solar energy received at 55, 60, and 65 degrees north latitude, plotted against time (figure 14).
He had calculated these values at intervals of 10,000 years back to 650,000 years ago, and it had taken him just over three months of intense work.
Instead of plotting the actual solar energy values, or the estimated temperatures, which he knew were problematic because of the redistribution of heat by the ocean and atmosphere, he plotted what he referred to as the “equivalent latitude.”
This was an interesting idea because it showed immediately whether the latitudes he had chosen for his calculations received more (lower equivalent latitude) or less (higher equivalent latitude) solar radiation—usually referred to as “insolation”—than the same latitude does today.
For example, Milankovitch’s work indicated that
230,000 years ago, during the northern summer, the Earth received only as much solar energy at 65° N latitude as it receives today ten degrees further north.
The equivalent latitude was 75° N (figure 14), indicating that the summer temperatures were much cooler at that time.
Köppen was pleased with the graphs.
One of the reasons he had asked Milankovitch to calculate temperatures back to 600,000 years was that in the late 1800s, two German scientists, Albrecht Penck and Eduard Brückner, had developed a timescale for glaciation in the Alps that covered exactly that period.
Based on observations of gravel terraces along Alpine river valleys, they had identified four glacial periods during this interval.
Each terrace, they believed, corresponded to a period when active glacial erosion of the valley walls provided an abundant supply of gravel; when glaciation ended, the rivers could no longer transport much gravel and would begin to cut down through previously deposited sediments.
As this was before the advent of radioactive dating techniques, they had to determine the age of each of the glacial periods by making assumptions about the rate at which the geological processes had operated.
They simply measured the difference in elevation between successive terraces, and divided that distance by the rate at which they estimated the streams had eroded their beds.
This was a very crude way to obtain the time that had elapsed between the formation of each of the terraces—and by implication, the successive glacial periods—but although most geologists recognized that the estimates were uncertain at best, real numbers published in papers by respectable scientists are seductive.
Soon the four glacial periods described by Penck and Brückner became part of the vocabulary of European geologists, and the fact that American geologists had also mapped out drift deposits that seemed to come from four separate glacial advances gave their scheme added respectability.
Even after other workers began to point out flaws in the Penck and Brückner field evidence, their version of the temperature history of Europe continued to be popular.
It remained so into the 1940s before finally being discarded.
The Penck and Brückner scenario was very much in vogue when Köppen first saw Milankovitch’s extended graph of equivalent latitudes.
He realized at first glance that there was a close correspondence between the two—the times when Milankovitch’s graph indicated cold Northern Hemisphere summers corresponded well to the times of Alpine glaciation based on the gravel terraces.
The coincidence between these independent records—one theoretical and the other derived from field evidence—was very convincing; it seemed almost too good to be true.
Milankovitch published the graph in a paper under his own name, and Köppen and Wegener put it in their book on past climates, with due credit to Milankovitch.
The Köppen and Wegener book,
Die Klimate der geologischen Vorzeit
(Climates of the Geological Past), published in 1924, reached a wide audience and quickly brought Milankovitch worldwide prominence.
The similarity between his graphs and the Penck and Brückner glacial timescale was so persuasive that he was generally acknowledged to have proven the astronomical theory of climate.
Milankovitch’s graph soon became a cornerstone of much ongoing ice age research.
Rather than testing his results further against other estimates of glacial timing, many geologists instead simply accepted them and began to use the graphs as a way to date glacial deposits.
This was precisely what James Croll, many years earlier, had predicted could be done with his own graphs of the Earth’s orbital variations.
Milankovitch did not rest on his laurels when his work became more widely known.
Instead, over the next decade he continued to refine his calculations.
He pushed them back even farther into the past, to a million years before the present.
He expanded the range so that his results extended from 5° to 75° latitude, both north and south of the equator.
As more precise data on the masses of the planets and their orbits became available, he incorporated them into his calculations of the Earth’s orbital variations.
Although these refinements did not materially change the conclusions that he, Köppen, and Wegener had drawn about past climate, they did provide a much more comprehensive
picture of how the astronomical factors influence the solar energy budget over the Earth’s surface through time.
In the midst of this work, Wegener, who by this time had become a close friend, died tragically during a scientific expedition on the Greenland ice cap.
The news of his death reached Milankovitch in May 1931, and although he had been expecting the worst—Wegener had set out on a dogsled journey the previous September and had not been heard from in the intervening months—it was a great blow.
Wegener had been only fifty, and there was much he had still wanted to accomplish.
His body has never been found.
Although Milankovitch’s calculations and the conclusion that he, Wegener, and Köppen had come to about the connection between glaciation and insolation changes gained widespread acceptance, there was one question that continued to nag him.
Beyond the general idea that glaciation coincided with periods of cool northern summers, he had no concrete criterion for the initiation of a glacial period.
Were the insolation variations themselves sufficient?
Or was there some other factor involved?
Milankovitch recognized, as had earlier workers, that the “snow line,” the elevation at which permanent snow exists in the mountains, is an important indicator of average temperature.
The elevation of the snow line varies with latitude—at present, permanent snow and ice occur at sea level at the poles, while in the tropics, they exist only on the highest mountains.
Milankovitch realized that if the astronomical variations affected average temperatures—as his calculations showed—then they would also be correlated with the rise and fall of the snow line at a particular latitude.
The difficulty was to find a mathematical relationship connecting the elevation of the snow line with his results for insolation.
He realized, as had Croll, that there is positive feedback involved, because snow is much more reflective than forest or open ground, and as snow cover increases, more solar energy is reflected back into space.
Fortunately, the appropriate measurements on snow and ice reflectivity had been made in the early 1930s, and Milankovitch could plug the relevant parameters into his equations with some confidence.
The results were encouraging: the general pattern of his earlier curves
remained, but the intensity of the cold periods increased when the reflective effects of the snow were included.
When he calculated the altitude of the permanent snow line, he found that it descended to low elevations during the cold periods, and rose when it became warmer.
In effect, a snow line near sea level meant that a permanent ice cap had formed.
It appeared that the insolation variations, amplified by the effect of increasing snow cover, could indeed trigger the onset of glaciation.