Read The Better Angels of Our Nature: Why Violence Has Declined Online
Authors: Steven Pinker
Tags: #Sociology, #Psychology, #Science, #Social History, #21st Century, #Crime, #Anthropology, #Amazon.com, #Retail, #Criminology
The Better Angels of Our Nature: Why Violence Has Declined (67 page)

BOOK: The Better Angels of Our Nature: Why Violence Has Declined
8.14Mb size Format: txt, pdf, ePub
ads
Like Lewis Richardson, the new conflict-counters have to deal with failures of thinginess, and so they divide the conflicts into categories using obsessivecompulsive criteria.
14
The first cut distinguishes three kinds of mass violence that vary in their causes and, just as importantly, in their countability. The concept of “war” (and its milder version, “armed conflict”) applies most naturally to multiple killing that is organized and socially legitimated. That invites a definition in which a “war” must have a government on at least one side, and the two sides must be contesting some identifiable resource, usually a territory or the machinery of government. To make this clear, the datasets call wars in this narrow sense “state-based armed conflicts,” and they are the only conflicts for which data go all the way back to 1946.
The second category embraces “nonstate” or “intercommunal” conflict, and it pits warlords, militias, or paramilitaries (often aligned with ethnic or religious groups) against each other.
The third category has the clinical name “one-sided violence” and embraces genocides, politicides, and other massacres of unarmed civilians, whether perpetrated by governments or by militias. The exclusion of one-sided violence from the PRIO dataset is in part a tactical choice to divide violence into categories with different causes, but it is also a legacy of historians’ long-standing fascination with war at the expense of genocide, which only recently has been recognized as more destructive of human life.
15
Rudolph Rummel, the political scientist Barbara Harff, and the UCDP have collected datasets of genocides, which we will examine in the next section.
16
15
Rudolph Rummel, the political scientist Barbara Harff, and the UCDP have collected datasets of genocides, which we will examine in the next section.
16
The first of the three categories, state-based conflicts, is then subdivided according to whom the government is fighting. The prototypical war is the
interstate
war, which pits two states against each other, such as the Iran-Iraq War of 1980–88. Then there are
extrastate
or
extrasystemic
wars, in which a government wages war on an entity outside its borders that is not a recognized state. These are generally imperial wars, in which a state fights indigenous forces to acquire a colony, or colonial wars, in which it fights to retain one, such as France in Algeria from 1954 to 1962.
Finally there are civil or
intrastate
wars, in which the government fights an insurrection, rebellion, or secessionist movement. These are further subdivided into civil wars that are completely internal (such as the recently concluded war in Sri Lanka between the government and the Tamil Tigers) and the
internationalized intrastate
wars in which a foreign army intervenes, usually to help a government defend itself against the rebels. The wars in Afghanistan and Iraq both began as interstate conflicts (the United States and its allies against Taliban-controlled Afghanistan, and the United States and its allies against Baathist-controlled Iraq), but as soon as the governments were toppled and the invading armies remained in the country to support the new governments against insurgencies, the conflicts were reclassified as internationalized intrastate conflicts.
Now there’s the question of which deaths to count. The PRIO and UCDP datasets tally direct or
battle-related deaths—
the people who are shot, stabbed, clubbed, gassed, blown up, drowned, or deliberately starved as part of a contest in which the perpetrators themselves have to worry about getting hurt.
17
The victims may be soldiers, or they may be civilians who were caught in the crossfire or killed in “collateral damage.” The battle-related death statistics exclude
indirect deaths
arising from disease, starvation, stress, and the breakdown of infrastructure. When indirect deaths are added to direct deaths to yield the entire toll attributable to the war, the sum may be called
excess deaths
.
Why do the datasets exclude indirect deaths? It’s not to write these kinds of suffering out of the history books, but because direct deaths are the only ones that can be counted with confidence. Direct deaths also conform to our basic intuition of what it means for an agent to be responsible for an effect that it causes, namely that the agent foresees the effect, intends for it to happen, and makes it happen via a chain of events that does not have too many uncontrollable intervening links.
18
The problem with estimating indirect deaths is that itit requires us to undertake the philosophical exercise of simulating in our imagination the possible world in which the war didn’t occur and estimating the number of deaths that took place in that world, which then is used as a baseline. And that requires something close to omniscience. Would a postwar famine have taken place even if the war had not broken out because of the ineptitude of the overthrown government? What if there was a drought that year—should the famine deaths be blamed on the war or on the weather? If the rate of death from hunger was going down in the years before a war, should we assume that it would have declined even further if the war hadn’t occurred, or should we freeze it at its level in the last year before the war? If Saddam Hussein had not been deposed, would he have gone on to kill more political enemies than the number of people who died in the intercommunal violence following his defeat? Should we add the 40 to 50 million victims of the 1918 influenza pandemic to the 15 million who were killed in World War I, because the flu virus would not have evolved its virulence if the war hadn’t packed so many troops into trenches?
19
Estimating indirect deaths requires answering these sorts of questions in a consistent way for hundreds of conflicts, an impossible undertaking.
Wars, in general, tend to be destructive in many ways at once, and the ones that kill more people on the battlefield also generally lead to more deaths from famine, disease, and the disruption of services. To the extent that they do, trends in battle deaths can serve as a proxy for trends in overall destructiveness. But they don’t in every case, and later in the chapter we will ask whether developing nations, with their fragile infrastructure, are more vulnerable to knock-on effects than advanced nations, and whether this ratio has changed over time, making battle deaths a misleading index of trends in the human toll of conflict.

Now that we have the precision instrument of conflict datasets, what do they tell us about the recent trajectory of war in the entire world? Let’s begin with the bird’s-eye view of the 20th century in figure 6–1. The viewing was arranged by Lacina, Gleditsch, and Russett, who retrofitted numbers from the Correlates of War Project from 1900 to 1945 to the PRIO dataset from 1946 to 2005, and divided the numbers by the size of the world’s population, to yield an individual’s risk of dying in battle over the century.
The graph reminds us of the freakish destructiveness of the two world wars. They were not steps on a staircase, or swings of a pendulum, but massive spikes poking through a bumpy lowland. The drop-off in the rate of battle deaths after the early 1940s (peaking at 300 per 100,000 people per year) has been precipitous; the world has seen nothing close to that level since.
Eagle-eyed readers will spot a decline within the decline, from some small peaks in the immediate postwar decade to the low-lying flats of today. Let’s zoom in on this trend in figure 6–2, while also subdividing the battle deaths according to the type of war that caused them.
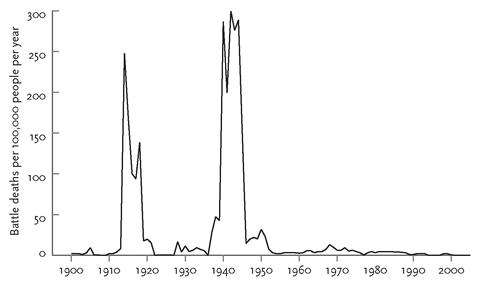
FIGURE 6–1.
Rate of battle deaths in state-based armed conflicts, 1900–2005
Rate of battle deaths in state-based armed conflicts, 1900–2005
Source:
Graph from Russett, 2008, based on Lacina, Gleditsch, & Russett, 2006.
Graph from Russett, 2008, based on Lacina, Gleditsch, & Russett, 2006.
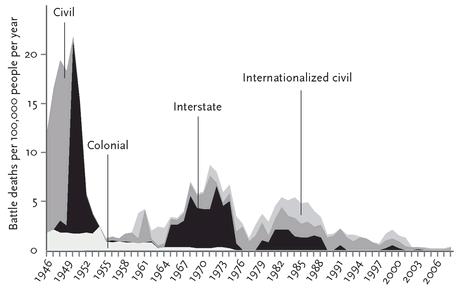
FIGURE 6–2.
Rate of battle deaths in state-based armed conflicts, 1946–2008
Rate of battle deaths in state-based armed conflicts, 1946–2008
Civilian and military battle deaths in state-based armed conflicts, divided by world population.
Sources:
UCDP/PRIO Armed Conflict Dataset; see Human Security Report Project, 2007, based on data from Lacina & Gleditsch, 2005, updated in 2010 by Tara Cooper. “Best” estimate used when available; otherwise the geometric mean of the “High” and “Low” estimates is used. World population figures from U.S. Census Bureau, 2010c. Population data for 1946–49 were taken from McEvedy & Jones, 1978, and multiplied by 1.01 to make them commensurable with the rest.
This is an area graph, in which the thickness of each layer represents the rate of battle deaths for a particular kind of state-based conflict, and the height of the stack of layers represents the rate for all the conflicts combined. First take a moment to behold the overall shape of the trajectory. Even after we have lopped off the massive ski-jump from World War II, no one could miss another steep falloff in the rate of getting killed in battle that has taken place over the past sixty years, with a paper-thin laminate for the first decade of the 21st century at the end. This period, even with thirty-one ongoing conflicts in that mid-decade (including Iraq, Afghanistan, Chad, Sri Lanka, and Sudan), enjoyed an astoundingly low rate of battle deaths: around 0.5 per 100,000 per year, falling below the homicide rate of even the world’s most peaceable societies.
20
The figures, granted, are lowballs, since they include only reported battle deaths, but that is true for the entire time series. And even if we were to multiply the recent figures by five, they would sit well below the world’s overall homicide rate of 8.8 per 100,000 per year.
21
In absolute numbers, annual battle deaths have fallen by more than 90 percent, from around half a million per year in the late 1940s to around thirty thousand a year in the early 2000s. So believe it or not, from a global, historical, and quantitative perspective, the dream of the 1960s folk songs has come true: the world has (almost) put an end to war.
Let’s take our jaws off the table and look more closely at what happened category by category. We can start with the pale patch at the bottom left, which represents a kind of war that has vanished off the face of the earth: the extrastate or colonial war. Wars in which a great power tried to hang on to a colony could be extremely destructive, such as France’s attempts to retain Vietnam between 1946 and 1954 (375,000 battle deaths) and Algeria between 1954 and 1962 (182,500 battle deaths).
22
After what has been called “the greatest transfer of power in world history,” this kind of war no longer exists.
22
After what has been called “the greatest transfer of power in world history,” this kind of war no longer exists.
Now look at the black layer, for wars between states. It is bunched up in three large patches, each thinner than its predecessor: one which includes the Korean War from 1950 to 1953 (a million battle deaths spread over four years), one which includes the Vietnam War from 1962 to 1975 (1.6 million battle deaths spread over fourteen years), and one which includes the Iran-Iraq War (645,000 battle deaths spread over nine years).
23
Since the end of the Cold War, there have been only two significant interstate wars: the first Gulf War, with 23,000 battle deaths, and the 1998–2000 war between Eritrea and Ethiopia, with 50,000. By the first decade of the new millennium, interstate wars had become few in number, mostly brief, and relatively low in battle deaths (India-Pakistan and Eritrea-Djibouti, neither of which counts as a “war” in the technical sense of having a thousand deaths a year, and the quick overthrow of the regimes in Afghanistan and Iraq). In 2004, 2005, 2006, 2007, and 2009, there were no interstate conflicts at all.
BOOK: The Better Angels of Our Nature: Why Violence Has Declined
8.14Mb size Format: txt, pdf, ePub
ads
Other books
Eating Fire: My Life as a Lesbian Avenger by Kelly Cogswell
Sacrifice by Cindy Pon
The John Green Collection by John Green
Billionaire's Pet 3 by Christa Wick
Lexington Black by Savannah Smythe
Everyone's Favorite Girl by Steph Sweeney
Annie Seymour 01-Sacred Cows by Karen E. Olson
Pteranodon Mall by Ian Woodhead
The Pretty Ones by Ania Ahlborn
La esfinge de los hielos by Julio Verne