The Little Ice Age: How Climate Made History 1300-1850 (12 page)
Read The Little Ice Age: How Climate Made History 1300-1850 Online
Authors: Brian Fagan

Fluctuating grain prices are another barometer of changing temperatures, in the sense that they can be used to identify cycles of unusually wet or dry weather that brought poor harvest in their train. Economic
historians like W. G. Hoskins have tracked grain prices over many centuries and chronicled rises of 55 percent to as much as 88 percent above
normal at times of scarcity, when hoarders and merchants stockpiled
grain with an eye to a windfall profit or cereals were just in short supply.
In countries like Britain or France, where bread was a staple, such rises
could be catastrophic, especially for the poor. In the social disorders that
usually followed, farmers lived in fear of their crops being pillaged before
they were ripe, and mobs descended on markets to force bakers to sell
bread at what they considered to be fair prices. Monastery records and the
archives of large estates are a mine of information about harvests good
and bad, about prices and yields, but, like most early historical sources,
they lack the precision of a tree-ring sequence or an ice core. Annalists
would write of heavy rain storms that "in many places, as happens in a
flood, buildings, walls, and keeps were undermined," but such vivid descriptions are no substitute for reliable daily temperature readings.3
The dates of wine harvests, derived from municipal and tithe records,
also vineyard archives, provide a general impression of cooler and warmer
summers, with the best results coming from linking such information
with readings from tree rings and other scientific sources. The climate
historian Christian Pfister focuses on two crucial months that stand out
in colder periods: cold Marches and cool and wet Julys. Such conditions
marked 1570 to 1600, the 1690s, and the 1810s, probably the coldest
decades of the Little Ice Age.4
Climatic historians are ingenious scholars. For instance the Hudson's
Bay Company insisted that its captains and factors in the Canadian Arctic keep weather records on a daily basis even at its most remote stations.
Since the same employees often worked for the company for many years,
the records of ice conditions and of the first thaw and snowfall are remarkably accurate for the late eighteenth and early nineteenth centuries,
to the point that you can track annual fluctuations in first snowfall and
the beginning of the spring thaw to within a week, even a few days, over
long periods of years. Spanish scholars are using the records of rogation
ceremonies performed to pray for rain or an end to a deluge. Rogation
rituals were rigorously controlled by the church and unfolded at various
levels, culminating in years of crisis in formal processions and pilgrimages. Thus, they provide a crude barometer of climatic fluctuations.
Historical records like these clearly display minor fluctuations between
decades, but how they relate to broader climate change is a matter for future research. In recent years, statistical methods are being used to test indices developed from historical sources against tree-ring and other scientific climatic data. From such tests we learn, for example, that
sixteenth-century central Europe was cooler at all seasons than the period
1901 to 1960, and that winters and springs were about 0.5° cooler, with
autumn rainfall about 5 percent higher. Almost uninterrupted cold winters settled over the area between 1586 and 1595, with temperatures
about 2°C cooler than the early twentieth-century mean. The same indices proclaim 1691-1700 and 1886-95 as the coldest decades in
Switzerland over the past five centuries.
For all the richness and diversity of archival records, we have to rely in
large part on scientific sources for year-by-year climatic information on
the Little Ice Age. This record comes in part from ice cores, sunk deep
into the Greenland ice cap, into Antarctic ice sheets, including one at the
South Pole, and into mountain glaciers like that at Quelccaya in the
southern Andes of Peru. Ice-core research bristles with highly technical
difficulties, many of them resulting from the complex processes by which
annual snowfall layers are buried deeper and deeper in a glacier until they
are finally compressed into ice. Scientists have had to learn the different
textures characteristic of summer and winter ice, so they can assemble a
long record of precipitation that goes back deep into the past. Snowfall
changes are especially important because they provide vital evidence on
the rate of warming and cooling during sudden climatic changes.
Two cores from the Greenland ice cap, known as GISP-1 and 2, are of
particular interest for the Little Ice Age. GISP-2 has an accuracy in calendar years of ±1 percent, which makes it exceptionally useful for dating
temperature changes, themselves identified by changes in the isotopic signal of deuterium (D) from year to year, even season to season. Lower isotopic excursions signal low temperatures, such as those in Greenland during the fourteenth century, where winters were the coldest they have been
over the past seven hundred years. Ice-core climatic reconstructions offer
great promise for studying the short-term cycles of warmer and colder
conditions that affected the medieval Norse settlements in Greenland.
Until the 1960s, tree-ring research was largely confined to the Southwestern United States, where astronomer Andrew Douglass achieved sci entific immortality by dating ancient Indian pueblos from the annual
growth rings in desiccated wooden lintel beams. Since then, thousands of
tree-ring sequences have come from the Southwest, to the point that experts can trace the year-by-year progression of serious droughts across the
region 1,000 years ago. Originally, tree-ring dating was applied only in
areas with markedly seasonal rainfall, but the science is now so refined
that we have highly accurate sequences from German and Irish oaks going back at least 8,000 years.
Tree-ring temperature reconstructions now span the entire Northern
Hemisphere and come from over 380 locations. We have the first interannual and interdecadal temperature variability curves as far back as A.D.
1400 or earlier, with very reliable data for the years after 1600.5 Such
temperature estimates, acquired by statistical regression analyses from
modern instrument records or by proxies from historical records and
other sources, are vital to establishing just how warm the late twentieth
century has been in comparison with earlier times.
Major volcanic eruptions, like that which destroyed Roman Herculaneum and Pompeii in A.D. 79, are spectacular, often catastrophic events.
The greatest of them can be detected in tree-ring sequences and through
fine dust in ice cores. Eruptions have important climatic consequences
because of the fine dust they throw out, which can linger in the atmosphere for years on end. Hypotheses linking eruptions and weather have
been around a long time. Benjamin Franklin theorized that volcanic dust
could lower temperatures on earth. In 1913, a U.S. Weather Bureau scientist named William Humphreys used data from the spectacular
Krakatau eruption in Southeast Asia in 1883 to document the correlation
between historic volcanic eruptions and worldwide temperature changes.
Volcanic dust is some thirty times more effective in shielding the earth
from solar radiation than it is in preventing the earth's heat from escaping. During the three years it may take for the dust from a large eruption
to settle out, the average temperature of much of the globe may drop as
much as a degree, perhaps even more. The effects tend to be most marked
during the summer following a major volcanic event.
The provisional temperature curves for the Little Ice Age display some
conspicuous downward spikes, when a single year was unusually cold. Almost invariably, these are associated with major eruptions, such as that of Mount Tambora in southeast Asia in 1815, the most spectacular eruption
of the past 15,000 years. Over the next few years, Tambora's ash drifted
through the atmosphere and dimmed the sun. The year 1816 appears as a
sharp cold spike in the climatologists' temperature diagrams, the "year
without a summer" when snow fell in New England in June and Europe
shivered through a frigid September. Major volcanic eruptions almost invariably brought colder summers and bad harvests, natural phenomena
unconnected with the endless perturbations of the Little Ice Age. During
the seventeenth century, an unusual frequency of volcanic events contributed to the volatility of climate change.

What caused the Little Ice Age? Did small changes in the earth's axis affect
global temperatures for five centuries? Or did cyclical fluctuations in solar
radiation lead to greater cooling? The answer still eludes us, largely because
we have barely begun to understand the global climatic system and the interactions between atmosphere and ocean that drive it. There are few certainties. One is that we still live in the Great Ice Age, somewhere near the
midpoint of an interglacial, one of the many that have developed over the
past three-quarters of a million years. In the fullness of time-according to
some estimates, in the next 23,000 years-the world will most likely return to another glacial cycle, with temperatures as extreme as those of
18,000 years ago, when much of Europe really was in a deep freeze.
Slow, cyclical changes in the eccentricity of the earth's orbit and in the
tilt and orientation of its spin axis have constantly changed patterns of
evaporation and rainfall and the intensity of the passing seasons over the
past 730,000 years. As a result, the world has shifted constantly between
extreme cold and short warmer periods. The geochemist Wallace
Broecker believes these changes caused the entire ocean-atmosphere system to flip suddenly from one mode during glacial episodes to an entirely
different one during warmer periods. He argues that each flip of the
"switch" changed ocean circulation profoundly, so that heat was carried
around the world differently. In other words, Ice Age climatic patterns
were very different from those of the past 10,000 years.
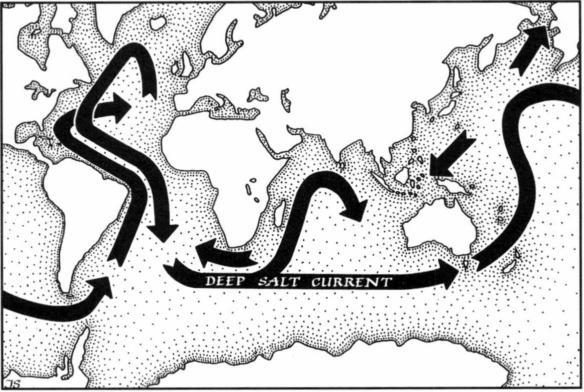
The Great Ocean Conveyor Belt, which circulates saltwater deep below the
surface of the world's oceans. Salt downwelling in the North Atlantic Ocean
plays a vital part in this circulation.
If Broecker is correct, then today's climatic mode results from what he
calls the "Great Ocean Conveyor Belt." % Giant, conveyor-like cells circulate
water through the world's oceans. In the Atlantic, warm, upper-level water
flows northward until it reaches the vicinity of Greenland. Cooled by Arctic
air, the surface waters sink and form a current that covers enormous distances at great depths, to the South Atlantic and Antarctica, and from there
into the Pacific and Indian Oceans. A southward movement of surface waters in these oceans counters the northward flow of cold bottom water. In
the Atlantic the northward counterflow is sucked along by the faster southward conveyor belt, which is fed by salt-dense water downwelling from the
surface in northern seas. The Atlantic conveyor circulation has power
equivalent to one hundred Amazon Rivers. Vast amounts of heat flow
northward and rise into the Arctic air masses over the North Atlantic. This
heat transfer accounts for Europe's relatively warm oceanic climate, which
has persisted, with vicissitudes, through ten millennia of the Holocene.
We understand the Great Ocean Conveyor Belt in only the most general terms, but enough to know that circulation changes in the upper ocean have a profound effect on global climatic events like El Niflos. We
know, also, that the chaotic equations of the atmosphere and ocean exercise a powerful influence on the swirling atmospheric streams, surface
downwelling, and shifting currents of the North Atlantic. Broecker and
others have recently turned their attention to the deep sea, to changes in
the thermohaline circulation (marine circulation caused by differences in
the temperature and salinity of sea water).?
Since it was discovered in the 1980s, we have assumed that the ocean
conveyor belt has operated smoothly throughout the Holocene. Under
this scenario, nearly equal amounts of deep ocean water originate in the
North Atlantic and around the perimeter of the Antarctic and are thoroughly mixed during their northward and southward passages. This
mixing occurs when surface water exposed to atmospheric gases descends into the deep ocean. This long-held assumption may be wrong,
for we now know something is different in today's Southern Ocean. The
Weddell Sea in Antarctica has produced much smaller quantities of
mixed deep water than expected over the decades since scientific observations began. In contrast, the North Atlantic is now producing deep
water at a rate consistent with that needed to maintain its natural carbon
14 (14C) level. Broecker theorizes that Southern Ocean deep water production was much greater during the Little Ice Age than today, just as it
was during the last glacial maximum of the Ice Age and during the
short-lived and cold Younger Dryas period of 11,500 years ago.