The Numbers Behind NUMB3RS (10 page)
Read The Numbers Behind NUMB3RS Online
Authors: Keith Devlin

For our example, this means that if the event occurs, you multiply S by
1
/7 and divide the result by
1
/30 (i.e., you multiply by 4.286); and if the event does not occur, you multiply S by
6
/7 and divide the result by
29
/30 (i.e., you multiply by 0.8867). In the former case, the value of S will increase. In the latter case, S decreases; if the new value of S is less than 1, you reset S to 1. (By never letting S be less than 1, the process remains in readiness to react to a change at any time.)
Because the event we're interested in is
more probable once a change has occurred
, on days when that event happens, S gets larger. And, not surprisingly, S gets smaller on days when the event does not happen.
This procedure is easy to carry out on a calculator. Suppose we start from scratch and see successive days as follows:
Â
No, No, Yes (the event occurred), No, No, No, No, No, No, Yes,â¦
Â
We start with S = 1. The first “No” gives S = 1 Ã .8867 = .8867, so we reset S = 1. The second “No” also gives S = .8867 and again we reset S = 1. Then we get a “Yes” and set S = 1 Ã 4.286 = 4.286. The following “No” gives S = 4.286 Ã .8867 = 3.800.
Continuing along the sequence of observations, we get the subsequent values 3.370, 2.988, 2.649, 2.349, 2.083, at which point we get the second “Yes”, giving S = 8.927.
If we keep getting “Yes” this often, S will reach a threshold like 50 pretty quickly. But even
after
a change to 1 chance in 7 every day, it's not unusual to go two weeks without the event occurring, and that would multiply S by .8867 each dayâunless the “never let S go below 1” rule kicks in.
If we use a computer to generate random days with a 1 out of 30 chance of the event every day, and each day is a new try, regardless of the history, it turns out that when a threshold of 50 is used for S, false indicators of a change will occur roughly 1,250 days apartâroughly three and a half years. Meanwhile, the quickness of detection after a change to 1 out of 7 chance every day, is on average no more than thirty-three daysâabout a monthâeven if the change occurs when S happens to be 1 (the lowest value possible), as at the beginning of the process. That's a lot better than Shewhart's procedure could do.
It turns out that the cost of getting a large interval between false change indicators (known to statisticians as the average run length, or ARL) in terms of increased time to detect a change, is not great with Page's procedure. Large increases in the ARL are accompanied by fairly small increases in detection time. Table 5 gives some results (for this example) illustrating the trade-off.
Table 5. The relationship between average run length and speed of detection.

So, for all that it is a great improvement on Shewhart's method, Page's procedure still seems to take a long time to reliably detect a change. Can we do better? Unfortunately, there are theoretical limitations to what can be achieved, as a mathematician named G. V. Moustakides proved in 1986. He showed that when the distributions of the data values before and after a possible change are known, as they are in our example, Page's procedure is the best you can do.
This fundamental limitation on the ability to reliably detect changepoints is not merely frustrating to statisticians, it leaves society irrevocably vulnerable to threats in areas such as bioterrorism.
EARLY DETECTION OF A BIOTERRORIST ATTACK
A good example where changepoint detection is crucial is the
syndromic surveillance
we mentioned early in the chapter. The basic idea, which is being applied by many state and local health departments across the country, in cooperation with certain agencies of the federal government, goes like this: Suppose a terrorist attack uses an agent like anthrax or smallpox that can be released without causing an immediate alarm, so that the disease can spread for some time without alerting hospitals and public health officials.
In case of such an attack, it is critical for the authorities, particularly in the public health system, to be alerted as soon as possible so that they can figure out what is happening and take appropriate measures. These may include public warnings and bulletins to doctors and hospitals, describing what to look for in patients, how many people are likely to be affected and in which areas, and which methods to use in diagnosis and treatment.
Without having some system in place to accelerate the reaction of authorities, substantial delays could easily arise. Performing medical tests and confirming diagnoses can take time, and the possibility that the first patients may be few in number or scattered would contribute to the difficulty of recognizing a developing threat.
Faced with the limitations implied by Moustakides' 1986 result, researchers in the area of changepoint detection are constantly looking for better data sources to achieve the ultimate goal: the earliest possible detection of change.
In October 2006, the fifth annual Syndromic Surveillance Conference took place in Baltimore, Maryland. Research papers presented at the conference covered such topics as: Improving Detection Timeliness by Modeling and Correcting for Data Availability Delays; Syndromic Prediction Power: Comparing Covariates and Baselines; Efficient Large-scale Network-based Simulation of Disease Outbreaks; and Standard Operation Procedures for Three Syndromic Surveillance Systems in Washoe County, Nevada.
The greater the natural variability, the more severe is the problem of false alarms. But there is another aggravating factor: the sheer multiplicity of surveillance systems. The researchers at the conference pointed out that in the near future there may be thousands of such systems running simultaneously across the United States. Even if the frequency of false alarms is well controlled in each system, the overall rate of false alarms will be thousands of times greater, leading to obvious costs and concerns, including the classic “boy who cried wolf” phenomenon: Too many false alarms desensitize responders to real events.
How can the medical issues, the political issues, and the mathematical challenges associated with syndromic surveillance be addressed?
In several recent studies, researchers have used computer simulations to estimate how effective different mathematical methods will be in real-world performance. Results consistently show that when the Shewhart and Page approaches are compared, the latter is found to be superior. This is not a foregone conclusion, as the theorem of Moustakides, establishing that the Page procedure is the best possible, does not literally apply to the complicated problems that researchers are trying to solve. But mathematicians are used to the phenomenon that when a method or algorithm is proved to be the best possible in some simple situations it is likely to be close to the best one can do in more complicated situations.
Researchers are making intensive efforts to build a better foundation for success in using syndromic surveillance systems. The before-change scenarios require accurate knowledge of baseline dataâthat is, the appearance of patients in ERs with certain combinations of symptoms. The experts also pay considerable attention to the improvement of the probability estimates that go into the before-change part of the calculations. Several of the most common sets of symptoms that these surveillance systems look for have a greater probability of false positives during certain seasons of the yearâcold and flu season, for exampleâso that the calculations are much more accurate when the baseline probabilities are defined in a way that reflects seasonal effects.
Another key to improving these systems is sharpening the probability estimates for after-change (post-attack) scenarios. One recent study examines the potential to improve biosurveillance by incorporating geographical information into the analysis. By building in statistical measures of the way the symptom reports clusterâin particular their spatial distribution as well as their temporal distributionâsurveillance systems might gain greater power to detect outbreaks or abnormal patterns in disease incidence.
Mathematicians have other tricks up their sleeves that could help. The methods of Bayesian statistics (discussed in Chapter 6) can be used to incorporate certain kinds of useful information into changepoint detection calculations. Imagine that as we monitor a stream of data, looking for a changepoint, we have someone whispering hints in our earâtelling us at which points it is more likely or less likely that a change will occur. That is pretty much what the Department of Homeland Security's system of color-coded public alerts does, and the information gathered and assessed by intelligence agencies can be used to provide more focused alerts for certain types of disease-based terrorist attacks. Bayesian methods can incorporate such intelligence in a very natural and systematic wayâin effect, lowering the threshold for raising an alarm during periods when the probabilities of particular kinds of bioterrorist attacks are heightened.
As one mathematician recently summed up the current situation in syndromic surveillance: “Changepoint detection is dead. Long live (even better) changepoint detection.”
5
Image Enhancement and Reconstruction
THE REGINALD DENNY BEATING
On April 29, 1992, at 5:39
PM
, Reginald Oliver Denny, a thirty-nine-year-old, white truck driver loaded his red, eighteen-wheel construction truck with twenty-seven tons of sand and set off to deliver it to a plant in Ingle-wood, California. He had no idea that a little over an hour later, millions of television viewers would watch him being beaten to within an inch of his life by a rioting mob. Nor that the ensuing criminal prosecution of the rioters would involve a truly remarkable application of mathematics.
The sequence of events that led to Denny's beating had begun a year earlier, on March 3, 1991, when officers of the California Highway Patrol spotted a young black male, Rodney Glenn King, age twenty-six, speeding on Interstate 210. The officers chased King for eight miles at speeds in excess of 100 miles per hour, before finally managing to stop him in Lake View Terrace. When the CHP officers instructed him to lie down, King refused. At that point, a squad car of four Los Angeles Police Department officers arrived on the scene, and LAPD Sergeant Stacey Koon took command of the situation. When King then refused Sergeant Koon's command to comply with the instruction to lie down, Koon told his officers to use force. The police then started to hit King with their batons, and continued to beat him long after he had fallen to the ground. What the police did not know was that the entire event was being videotaped by a bystander, George Holliday, who would later sell the recording to the television networks.
Based largely on the videotapes, which were seen by television viewers all around the world, the four officers, three white and one Latino, were charged with “assault by force likely to produce great bodily injury” and with assault “under color of authority.” As the officers' defense counsel argued in court, the video showed that King behaved wildly and violently throughout the incident (he was eventually charged with felony evasion, although that charge was later dropped), but as a result of the considerable attention given to Holliday's videotape, the focus was no longer on King but on the actions of the policemen. The court case unfolded against the volatile backdrop of a city where racial tensions ran high, and relations between the black community and the largely white LAPD were badly strained. When, on April 29, 1992, three of the officers were acquitted by a jury of ten whites, one Latino, and an Asian (the jury could not agree on a verdict for one of the counts on one of the officers), massive rioting erupted across the entire Los Angeles region.
*
The riots would last for three days, making it one of the worst civil disturbances in Los Angeles history. By the time the police, Marine Corps, and National Guard restored order, there had been 58 riot-related deaths, 2,383 injuries, more than 7,000 fire responses, and damage to around 3,100 businesses amounted to over $1 billion. Smaller race riots broke out in other U.S. cities. On May 1, 1992, the third day of the Los Angeles riots, Rodney King went on television to appeal for calm and plead for peace, asking, “People, I just want to say, you know, can we all get along?”
But the rioting was just a few hours old as truck driver Reginald Denny turned off the Santa Monica Freeway and took a shortcut across Florence Avenue. At 6:46
PM
, after entering the intersection at Normandie, he found himself surrounded by black rioters who started to throw rocks at his windows, and he heard people shouting at him to stop. Overhead, a news helicopter piloted by reporter Bob Tur captured the events that followed.
One man opened the truck door, and others dragged Denny out. Denny was knocked to the ground and one of the assailants held his head down with his foot. Denny, who had done nothing to provoke the violence, was kicked in the stomach. Someone hurled a five-pound piece of medical equipment at Denny's head and hit him three times with a claw hammer. Still another man threw a slab of concrete at Denny's head and knocked him unconscious. The man, who would subsequently be identified as Damian Williams, then did a victory dance over Denny, flashing a gang sign at the news helicopter hovering above, which was broadcasting the events on live television, and pointed at Denny. Another rioter then spat on Denny and left with Williams. Several passersby took pictures of the attack but no one came to Denny's aid.
After the beating ended, various men threw beer bottles at the unconscious Denny. Someone came along and riffled through Denny's pockets, taking his wallet. Another man stopped near the body and attempted to shoot the gas tank of Denny's truck but missed. Eventually, with the attackers gone, four men who had been watching the events on TV came to Denny's aid. One of them was a trucker with a license that allowed him to drive Denny's truck. The four rescuers loaded the prostrate trucker into his cab and drove him to the hospital. Upon arrival at the hospital, Denny suffered a seizure.
Paramedics who attended to Denny said he came very close to death. His skull was fractured in ninety-one places and pushed into the brain. His left eye was so badly dislocated that it would have fallen into his sinus cavity had the surgeons not replaced the crushed bone with a piece of plastic. A permanent crater remains in his head to this day, despite efforts to correct it.
Based on identification from the TV news video taken from Bob Tur's helicopter, the three men most directly involved in the attack on Denny were arrested and brought to trial. Of the three, only one, Damian Williams, would be convicted, and then only on one felony charge, the court seeming to take the view (rightly or wrongly) that the acts were not premeditated and were the result of citywide mob mentality. For our present purpose, however, the most fascinating aspect of the case is that the identification of Williams was a result of some remarkable new mathematics, and the acceptance of those methods by the court was a milestone in legal history.
THE ROSE TATTOO
Although millions watched the attack on Denny on TV, either live or during endless repeats on news programs, and although the prosecution in the trial of Williams and his two accused accomplices showed forty minutes of video recordings of the event as evidence, identification of the assailants of sufficient reliability to secure a conviction proved difficult. The video footage had been shot from a small portable camera, handheld by Tur's wife, Marika, in a helicopter hovering above the scene. The result was grainy and blurred, and on no occasion did Marika Tur get a clear face shot of the assailants. The person shown throwing a large slab of concrete at Denny's head and then performing a victory dance over the victim's now unconscious body
could
have been Williams. But it equally could have been any one of hundreds of young black males in the Los Angeles area who shared his overall build and appearance.
One feature that did distinguish Williams from other possible suspects was a large tattoo of a rose on his left arm. (The tattoo identified him as a member of the notorious Los Angeles gang Eight Tray Gangster Crips.) Unfortunately, although some frames of the newsreel video did show the assailant's left arm, the image was not sharp enough to discern the tattoo.
At that point, the frustrated prosecutors got a major break. A Santa Monica reporter supplied them with some still photographs shot from a helicopter with a 400-millimeter long-distance lens. Thanks to the much higher resolution of still photographs, close scrutiny of one of the photographs, both with the naked eye and a magnifying glass, did reveal a vague gray region on the assailant's left arm as he stood over the prone body of Williams. (See figure 5.) The gray regionâa mere one six-thousandth of the overall area of the photographâmight indeed have been a tattoo; unfortunately, it could just as easily have been a smudge of dirt or even a blemish on the photo. Enter mathematics.
Using highly sophisticated mathematical techniques, developed initially to enhance surveillance photographs taken by military satellites, the crucial portion of the photograph was processed on a high-performance computer to generate a much clearer image. The resulting image revealed that the apparent mark on the suspect's left arm had a shape and color that, above the usual legal threshold of “beyond a reasonable doubt,” was indeed a rose tattoo like the one on Damian Williams' arm.
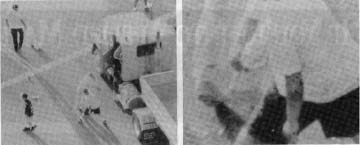
Figure 5. Mathematically enhanced aerial photograph of the Reginald Denny beating, with feature enlargement showing a blurred mark on the assailant's left arm.
The techniques used to process the photographic images in the Reginald Denny case fall in the general area known as
image enhancement
. This is not a technique for adjusting brightness, color, or contrast, or otherwise tweaking photographs familiar to computer users in the form of programs such as Photoshop, nor is it the proprietary photograph-handling software that often comes with new digital cameras. In image enhancement, mathematical techniques are used to
reconstruct
image details that were degraded by optical blurring in the original photograph.
The term “reconstruct” as used here can be misleading to laypersons unfamiliar with the technique. One of the key steps in the trial of Damian Williams was for the experts to convince the judge, and then the jury, that the process was reliable, and that the resulting image did not show “what
might
have been,” but did in fact reveal “what
was.
” The judge's ruling in the case, that images produced by enhancement techniques were indeed allowable evidence, was a landmark in legal history.
The general idea behind image enhancement is to use mathematics to supply features of the image that were not captured in the original photograph. No photograph will represent everything in a visual scene. Most photographs capture enough information that the human eye is often unable to discern any differences between the photograph and the original scene, and certainly enough for us to identify an individual. But as cognitive scientists have demonstrated, much of what we see when we look at either a real-life scene or a photograph is supplied by our brains, which fill inâgenerally reliably and accuratelyâanything that (for one reason or another) is missing from the visual signal that actually enters our eyes. When it comes to certain particular features in an image, mathematics is far more powerful, and can furnishâalso reliably and accuratelyâdetails that the photograph never fully captured in the first place.
In the Damian Williams trial, the key prosecution witness who identified the defendant was Dr. Leonid Rudin, the cofounder in 1988 of Cognitech, Inc., a Santa Monicaâbased company specializing in image processing. As a doctoral student at Caltech in the mid-1980s, Rudin developed a novel method for deblurring photographic images. Working with his colleagues at Cognitech, Rudin further developed the approach to the point where, when the Williams trial came to court, the Cognitech team was able to take video images of the beating and process them mathematically to produce a still image that showed what in the original video looked like a barely discernible smudge on the forearm of one of the assailants to be clearly identifiable as a rose tattoo like the one on Williams' arm. When the reconstructed photograph was presented to the jury for identification, Williams' defense team at once changed its position from “Williams is not the person in the photo/ video” to his being a “nonpremeditated” participant in the attack.
WHAT THE EYE CANNOT SEE: THE MATH OF IMAGE RECONSTRUCTION
To get some idea of the kind of problem facing the Cognitech engineers, imagine that we are faced with the comparably simpler task of simply enlarging a photograph (or part of a photograph) to twice its original size. (Enlargement of the key part of the Williams image was in fact one of the things Rudin and his colleagues did as part of their analysis.) The simplest approach is to add more pixels according to some simple rule. For example, suppose you start with an image stored as a 650 Ã 500 pixel grid and want to generate an enlarged version measuring 1300 Ã 1000 pixels. Your first step is to double the dimensions of the image by coloring the pixel location (2x,2y) the same as location (x,y) in the original image. This generates an image twice as large, but having lots of “holes” and hence being very grainy. (None of the pixels with at least one odd coordinate has a color.) To eliminate the graininess you could then color the remaining locations (the ones having at least one odd coordinate) by taking the mean of the color values for all adjacent pixels in the evens-evens grid.
Such a naïve method of filling in the holes would work fine for fairly homogeneous regions of the image, where changes from one pixel to the next are small, but where there is an edge or a sudden change in color, it could be disastrous, leading to, at best, blurred edges and, at worst, significant distortion (pixelation) of the image. Where there is an edge, for instance, you should really carry out the averaging procedure along the edge (to preserve the geometry of the edge) and then average separately in the two regions on either side. For an image with just a few, well-defined, and essentially straight edges, you could set this up by hand, but for a more typical image you would want the edge detection to be done automatically. This requires that the image-processing software can recognize edges. In effect, the computer must be programmed with the capacity to “understand” some features of the image. This can be done, but it is not easy, and requires some sophisticated mathematics.