Read The Numbers Behind NUMB3RS Online
Authors: Keith Devlin
The Numbers Behind NUMB3RS (6 page)

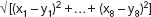
When the numerical coding has been completed, each perpetrator description is then represented by an eight-vector, the coordinates of a point in eight-dimensional geometric (Euclidean) space. The familiar distance measure of Euclidean geometry (the Pythagorean metric) can then be used to measure the geometric distance between each pair of points. This gives the distance between two vectors (x
1
,â¦, x
8
) and (y
1
,â¦, y
8
) as:
Points that are close together under this metric are likely to correspond to perpetrator descriptions that have several features in common; and the closer the points, the more features the descriptions are likely to have in common. (Remember, there are problems with this approach, which we'll get to momentarily. For the time being, however, let's suppose that things work more or less as just described.)
The challenge now is to identify clusters of points that are close together. If there were only two variables, this would be easy. All the points could be plotted on a single x,y-graph and visual inspection would indicate possible clusters. But human beings are totally unable to visualize eight-dimensional space, no matter what assistance the software system designers provide by way of data visualization tools. The way around this difficulty is to reduce the eight-dimensional array of points (descriptions) to a two-dimensional array (i.e., a matrix or table). The idea is to arrange the data points (that is, the vector representatives of the offender descriptions) in a two-dimensional grid in such a way that:
- pairs of points that are extremely close together in the eight-dimensional space are put into the same grid entry;
- pairs of points that are neighbors in the grid are close together in the eight-dimensional space; and
- points that are farther apart in the grid are farther apart in the space.
This can be done using a special kind of computer program known as a neural net, in particular, a Kohonen self-organizing map (or SOM). Neural nets (including SOMs) are described later in the chapter. For now, all we need to know is that these systems, which work iteratively, are extremely good at homing in (over the course of many iterations) on patterns, such as geometric clusters of the kind we are interested in, and thus can indeed take an eight-dimensional array of the kind described above and place the points appropriately in a two-dimensional grid. (Part of the skill required to use an SOM effectively in a case such as this is deciding in advance, or by some initial trial and error, what are the optimal dimensions of the final grid. The SOM needs that information in order to start work.)
Once the data has been put into the grid, law enforcement officers can examine grid squares that contain several entries, which are highly likely to come from a single gang responsible for a series of crimes, and can visually identify clusters on the grid, where there is also a likelihood that they represent gang activity. In either case, the officers can examine the corresponding original crime statement entries, looking for indications that those crimes are indeed the work of a single gang.
Now let's see what goes wrong with the method just described, and how to correct it.
The first problem is that the original encoding of entries as numbers is not systematic. This can lead to one variable dominating others when the entries are clustered using geometric distance (the Pythagorean metric) in eight-dimensional space. For example, a dimension that measures height (which could be anything between 60 inches and 76 inches) would dominate the entry for gender (0 or 1). So the first step is to scale (in mathematical terminology,
normalize
) the eight numerical variables, so that each one varies between 0 and 1.
One way to do that would be to simply scale down each variable by a multiplicative scaling factor appropriate for that particular feature (height, age, etc.). But that will introduce further problems when the separation distances are calculated; for example, if gender and height are among the variables, then, all other variables being roughly the same, a very tall woman would come out close to a very short man (because female gives a 0 and male gives a 1, whereas tall comes out close to 1 and short close to 0). Thus, a more sophisticated normalization procedure has to be used.
The approach finally adopted in the British Midlands study was to make every numerical entry binary (just 0 or 1). This meant splitting the continuous variables (age and height) into overlapping ranges (a few years and a few inches, respectively), with a 1 denoting an entry in a given range and a 0 meaning outside that range, and using pairs of binary variables to encode each factor of hair color, hair length, build, accent, and race. The exact coding chosen was fairly specific to the data being studied, so there is little to be gained from providing all the details here. (The age and height ranges were taken to be overlapping to account for entries toward the edges of the chosen ranges.) The normalization process resulted in a set of 46 binary variables. Thus, the geometric clustering was done over a geometric space of 46 dimensions.
Another problem was how to handle missing data. For example, what do you do if a victim's statement says nothing about the perpetrator's accent? If you enter a 0, that would amount to assigning an accent. But what will the clustering program do if you leave that entry blank? (In the British Midlands study, the program would treat a missing entry as 0.) Missing data points are in fact one of the major headaches for data miners, and there really is no universally good solution. If there are only a few such cases, you could either ignore them or else see what solutions you get with different values entered.
As mentioned earlier, a key decision that has to be made before the SOM can be run is the size of the resulting two-dimensional grid. It needs to be small enough so that the SOM is forced to put some data points into the same grid squares, and will also result in some non-empty grid squares having non-empty neighbors. The investigators in the British Midlands study eventually decided to opt for a five-by-seven grid. With 105 offender descriptions, this forced the SOM to create several multi-entry clusters.
The study itself concluded with experienced police officers examining the results and comparing them with the original victim statements and other relevant information (such as geographic proximity of crimes over a short timespan, which would be another indicator of a gang activity, not used in the cluster analysis), to determine how well the process performed. Though all parties involved in the study declared it to be successful, the significant amount of person-hours required means that such methods need further development, and greater automation of the various steps, before they can become widely used to fight criminal activity of the kind the study focused on. However, the method can be used to detect clusters in other kinds of criminal activity, such as terrorism. In such cases, where the stakes are so high, it may be well worth the investment of personnel and resources to make the method work.
SOFTWARE AGENTS
Software agents, a product of AI research, are essentially self-contained (and, in general, relatively small) computer programs designed to achieve specific goals, and that act autonomously, responding to changes in the environment in which they operate. Their autonomy is a result of their incorporating a range of different actions they can take, depending on particular inputs. Put crudely, they include a large number of if/then instructions.
For example, FinCEN, the U.S. Treasury agency whose job it is to detect money laundering, reviews every cash transaction involving more than $10,000. As there are about 10 million such transactions each year, this cannot be done manually. Instead, the agency uses software agents to carry out the monitoring automatically, using link analysis, among other tools, to look for unusual activity that might indicate fraud.
Banks use software agents to monitor credit card activity, looking for an unusual spending pattern that might indicate a stolen card. (You may have experienced having your credit card rejected when you tried to use it in novel circumstances, such as overseas or else in a city or a foreign country where there had beenâmost likely unbeknownst to youârecent fraudulent credit card use.)
The Defense Department, among other government and non-government organizations, has invested large amounts of money in the development of software agents for intelligence gathering and analysis. Typically, the strategy is to develop a coordinated system of agents that communicate with one another, each of which is designed to carry out one particular subtask. For example, a coordinated surveillance system to provide an early warning of a biological attack might include the following:
- Agents that receive and correlate data from different databases
- Agents that extract potentially relevant data from those databases
- Agents that analyze selected data and look for unusual patterns of biological events
- Agents that classify abnormalities and identify specific pathogens
- Agents that provide alerts to the emergency response personnel.
The initial data examined might include physicians' reports or patient symptoms, hospital outpatient reports, school attendance records, or sales of particular drugs by pharmacies. In each case, a sudden change from an established pattern might be due to a naturally occurring epidemic, but could provide the first signs of a biological attack. Humans would be unable to summarize the masses of data and survey the results in order to detect a changing situation sufficiently quickly to be able to initiate countermeasures. This has to be done using software.
MACHINE LEARNING
Machine learning, another branch of artificial intelligence, is perhaps the single most important tool within the law enforcement community's data-mining arsenal when it comes to profiling (and hence, one hopes, catching or preventing) criminals and terrorists.
Much of the power of machine learning algorithms stems from the fact that they automate the process of searching for and identifying key features in masses of data. This is something that a trained person can doâusually better, actuallyâbut only for small quantities of data. Machine learning algorithms are capable of finding the proverbial needle in a haystack.
For example, if you wanted to uncover a set of features that are characteristic of a terrorist or drug smuggler, you could apply an appropriate machine learning systemâof which there are many commercially availableâto a database of known (that is, already caught) terrorists or drug smugglers.
Following some initial input from you to determine the range of possible characteristics, the software would quiz the database in much the same fashion as in the familiar twenty-questions parlor game. The output from this process could be a list of if/then conditions, each one with an associated probability estimate, that provide the basis for a programâperhaps to be used at a border crossingâthat will check suspects to see if they are likely to be smuggling drugs. Alternatively, the database quizzing process might generate a decision tree that likewise may be used as the basis for a program that alerts law enforcement agents to possible terrorists or drug smugglers.
The first stage of this process is most easily understood using a simple example. Suppose you wanted the machine learning system to predict whether a given item is an apple, an orange, or a banana. You might start by telling it to look at weight, shape, or color. The system looks through its list of appropriate itemsâin this case, fruitâand first checks weights. It discovers that this feature does not distinguish between the three fruit. It then checks its list against shape. This feature is able to distinguish bananas from the other two (cylindrical/curved, as opposed to spherical), but is not sufficient to identify the fruit in every case. When presented with a test item, checking against shape would give the output
Â
BANANAâ100%
Â
if the item is a banana, but
Â
APPLEâ50% ORANGEâ50%
Â
in the other cases. finally, the system checks color. This time it finds that the feature distinguishes the three fruits with 100 percent accuracy.
When a machine learning algorithm is run against a sufficiently large database of past examples, it can often generate a short checklist or decision tree that a border guard or law enforcement agent, faced with a possible criminal or terrorist, can instruct the system to run through in real time to determine possible or likely guilt. Based on the aggregate probability of the suspect's guilt, the system can even advise the agent on what action to take, from “let through” to “arrest immediately”.