Understanding Sabermetrics (33 page)
Read Understanding Sabermetrics Online
Authors: Gabriel B. Costa,Michael R. Huber,John T. Saccoma

Murcer had an offensive winning percentage of .846, or 137 wins in a 162-game season.
(3)
Here is the data for Mark McGwire’s rookie season (1987):
From these numbers, his RC = 127.1 runs, his RCTECH = 131.5 runs, and his HDG23 = 130.8 runs. All are pretty close.
Inning 7: Win Shares(1a)
(1b)
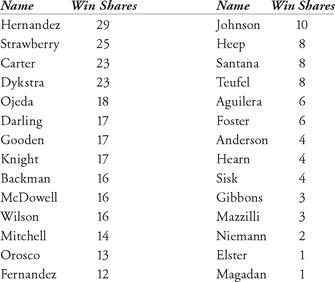
Win Shares Long-Form Answers:

In no particular order:
• Should individual records be expunged if it proved that steroids and/or other “enhancing” factors have been used by players?
• Should aluminum bats be used?
• Should managers have the option to appeal to video replay with respect to controversial rulings by umpires?
• Will countries in Asia, Latin America, etc. have major league franchises?
• Should there be a salary cap in major league baseball?
• Why not count all records, even if games are stopped before five innings, by just picking up the game where it was suspended? (Under Rule 4.10 of the official rules of Major League Baseball, a game is declared “No Game” if the umpire calls it before five innings have been completed or if the home team trails the visiting team and has not completed its fifth at-bat. All statistics are discounted.)
• When one considers interleague play, wild cards, teams changing leagues (i.e., the Milwaukee Brewers), and other factors, has baseball become “footballized”?
• Is baseball still the national pastime?
Whatever you as president of the National League decide, don’t use an asterisk!
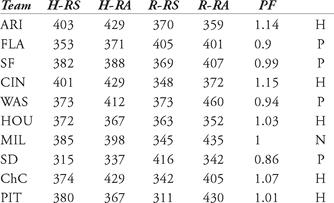
Inning 8: Park Effects(1)Crawford, 52.28; adj, 53.85
Jones, 101.13; adj, 103.15
Williams, 126.99; adj, 120.00
(2a)Betamit: 21.66
Wright: 119.15
ARamirez: 115.22
(2b)Betamit: 21.12
Wright: 125.11
ARamirez: 111.18
(3a)BOS: 1.13
OAK: 0.83
(3b)Yastrzemski: 113.31
Reynolds: 34.51
(3c)Yastrzemski: 105.95
Reynolds: 37.44
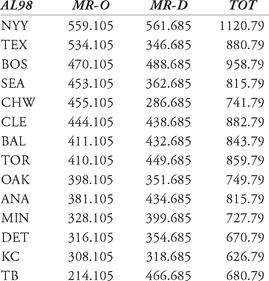
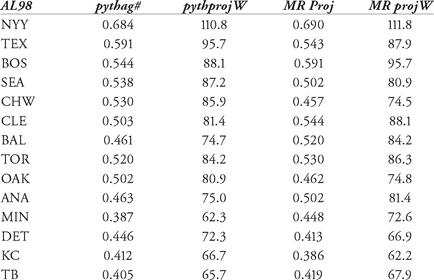
(4a)
(4b)
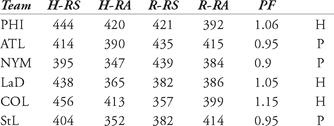
Repeat the directions for part (a) for the NL in 2006.
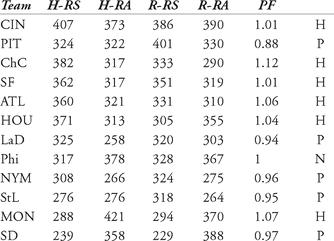
(a)
Calculate the PF for Fenway Park for each season from 1996-2006.
Calculate the PF for Fenway Park for each season from 1996-2006.
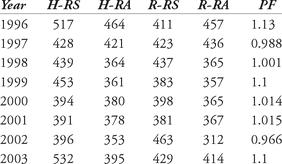
Anomaly: Fenway was a pitchers’ park in 1997 and 2002.
Inning 9: Creating Measures and Doing Sabermetrics — Some Examples(1)
In volume 34 of the
Baseball Research Journal
(SABR, 2005), we three authors published an article titled “Cumulative Home Run Frequency and the Recent Home Run Explosion.” In it, we considered all 500+ career home run hitters. In all but four cases, these sluggers seemed to have their cumulative home run ratio level off by the time they were 30 years of age. The only exceptions were: Barry Bonds, Mark McGwire, Rafael Palmeiro and Sammy Sosa.
(2)
Riordan’s instrument is very revealing. It gives a method to compare players from eras, thus providing a way to measure such things as “dominance” and “relativity.” It can be used either with cumulative statistics, such as hits, stolen bases, wins, saves, and errors, or with percentage statistics such as fielding average, batting average and earned run average. The calculations of peer-ratios would be very time-consuming without the Internet.
Riordan’s instrument is very revealing. It gives a method to compare players from eras, thus providing a way to measure such things as “dominance” and “relativity.” It can be used either with cumulative statistics, such as hits, stolen bases, wins, saves, and errors, or with percentage statistics such as fielding average, batting average and earned run average. The calculations of peer-ratios would be very time-consuming without the Internet.
(3)
Many factors come into play when studying the statistic K/9IP. There appears to be no correlation between having a large number of strikeouts and winning percentage. Also, the number of innings pitched for the single-season leaders are nowhere close to being uniform. However, in recent years, the league leaders are posting impressive strikeout numbers with an equally impressive number of innings. This discussion can go in many directions.
Easy TossesMany factors come into play when studying the statistic K/9IP. There appears to be no correlation between having a large number of strikeouts and winning percentage. Also, the number of innings pitched for the single-season leaders are nowhere close to being uniform. However, in recent years, the league leaders are posting impressive strikeout numbers with an equally impressive number of innings. This discussion can go in many directions.
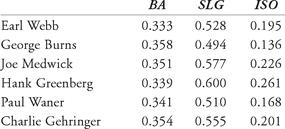
1. Hank Greenberg has the highest ISO.
2. Gibson: 3.58 / 2.18 = 1.63Clemens: 4.14 / 1.87 = 2.21Clemens had a better season, based solely on ERA relative to the league, than Gibson, which is hard to believe.
3. Blair in 1969: 2.81 RF, compared to a Lg RF of 1.84Jones in 1969: 1.86 RF, compared to a Lg RF of 1.75Blair, career in OF: 2.37 RF, compared to a Lg RF of 1.95Jones, career in OF: 1.86 RF, compared to a Lg RF of 1.85The Mets should have kept Blair.
Other books
Raising the Stakes by Trudee Romanek
Seize Me by Crystal Spears
Jane Doe No More by M. William Phelps
The Stolen Heart by Jacinta Carey
A Stirring from Salem by Sheri Anderson
Last Licks by Donally, Claire
Sweetbitter by Stephanie Danler
Raw Desire by Kate Pearce
Drawing the Line by Judith Cutler
Collins, Max Allan - Nathan Heller 08 by Blood (and Thunder) (v5.0)

