125 Physics Projects for the Evil Genius (4 page)
Read 125 Physics Projects for the Evil Genius Online
Authors: Jerry Silver

You never know what else might come in handy, such as buckets, rope, wire, hotplates, clamps, lazy susans, golf balls, various tools, and motors. Keep your eyes open.
Motion
Getting started. Constant velocity. Running the gauntlet
.
With little or no friction to stop it, a moving object will keep moving at a constant velocity. This experiment explores a few simple ways you can take friction out of the picture.
- Hover Puck
- tape measure
- 5 stopwatches
- masking tape
- several people to serve as timers
- Set up a course that is horizontal and free of obstructions. Do a trial run to make sure the Hover Puck does not move unless it’s pushed and that it follows a reasonably straight line. (If you don’t have a Hover Puck, a basketball or other similar object will do.)
- Place distance markers, such as masking tape labels, at regular intervals. (Typically in physics, meters are used for distance. However, for this project any convenient unit can work as long as you’re consistent throughout.)
- Each of the timers should be assigned to measure the time at a specific distance along the path.
- Timers should set their stopwatches to read zero and be prepared to start measuring the time as soon as the object starts moving.
- Push the puck (or basketball) in the designated direction. Start with a
medium push
. See
Figure 1-1
. - As the puck (or basketball) passes each mark, each timer should stop the stopwatch and note the time.
- Repeat with a slow push. A
slow push
is defined as slower than the medium push, but fast enough not to be pulled off course or stopped by friction. - Repeat with a
medium push
.
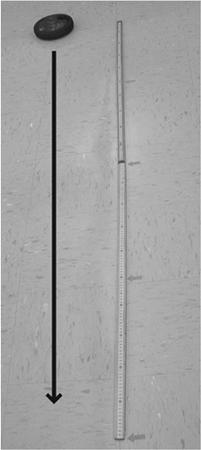
Figure 1-1
Nearly frictionless motion can be achieved using a Hover Puck
.
- Repeat with a
fast push
. This may be the most challenging one to time, especially for the first couple of timers. - The velocity for each of the runners will be the slope of the graph where distance is on the y-axis and time is on the x-axis.
- Place the people with the timers on the 10, 20, 30, 40, and 50 yard lines of a football field.
- Use a runner or several runners to run from the goal line to the 50 yard line.
- As in number 2, get the time that each runner passes the designated distance marker, and then plot and interpret the results.
With constant velocity, each of the graphs should be
linear
(a straight line). The fastest runner has the highest slope, followed by the medium runner, with the slowest runner bringing up the rear.
If, for some reason, the motion was not perfectly constant, the points that differed will not be on the line. For instance, if the assumption that friction can be ignored is not completely valid, you may see some deceleration. In that case, the overall linear curve may be seen to taper off with a lower slope than the earlier points. If these data come from runners, it can be used to determine how steady the runners actually are. Also, if the runners start from zero, the first 10 yards will show an upward curve indicating acceleration.
Figure 1-2
shows expected results for three runs of 0.5, 1.0, and 1.5 meters per second (m/s).
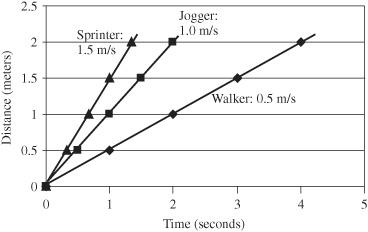
Figure 1-2
Distance versus time for three different velocities
.
Average velocity can be thought of as the distance you go divided by the amount of time it took to get there. More specifically, we can say
average velocity
is the change in distance divided by the change in time. v = Δd/Δt is the slope of the distance versus time graph. (Δ is the Greek letter delta, which means “change in.”)
This experiment can be done using a person riding in style in a Hovercraft, as pictured in
Figure 1-3
. This can be done as an interesting way to do the previous experiment or just simply for the fun of doing it.
Because of the nearly frictionless motion, the person moves at constant velocity and makes a perfect object to measure at various speeds. You can purchase a Hovercraft (PASCO, part number ME 9838).
A Hovercraft can also be built by following these basic steps:
- Drill a hole in the center of a 3-to-4 foot diameter piece of plywood.
- Cut a hole halfway between the center and the edge just large enough to fit the end of a leaf blower.
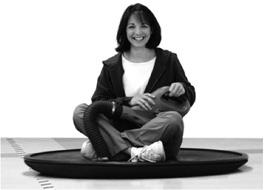
Figure 1-3
Hovercraft. Courtesy PASCO
.
- Staple a plastic sheet to the bottom of the Hovercraft. Trim off the excess plastic.
- Insert a bolt from the underside of the Hovercraft, through a plastic spacer (made from a plastic coffee-can lid). Attach the bolt through washers on the top and bottom, and then secure it with a nut.
- Tape all the seals between the leaf blower and the plywood, and the plastic sheet and the plywood, to make them as airtight as possible.
- Cut several approximately 2-inch diameter vent holes in the plastic sheet a few inches from the outer circumference of the plastic spacer.
- With the leaf blower turned on, a cushion of air should enable a person to move with a minimum of friction.
Detailed plans can be found at
http://amasci.com/amateur/hovercft.html
.
The tendency of a moving object to keep moving is called
inertia
, which is addressed in Newton’s first law. This is the subject of experiments that follow.
Constant velocity
is represented by a straight line on a distance versus time graph. The slope of the line is equal to the average velocity.
Picturing motion. Getting a move on
.
In the previous experiment, we worked with constant velocity in one direction and found that the motion was represented by simple graphs whose slopes were straight lines. Here, you study the motion of a person going forward and back, fast and slow. You also measure the effect of speeding up and slowing down. These graphs will take on a new dimension. In this experiment you use a motion sensor with display software to get a better feel for what different types of motion look like. Graphs are used to show where an object is at various times.
- motion sensor
- appropriate computer interface for the motion sensor
- (roughly) 8 inch by 10 inch piece of cardboard
- Attach a motion sensor to your computer. If you have a PASCO motion sensor, it is connected through the computer’s USB port by way of a computer interface. Follow the specific details provided by the sensor’s manufacturer.
- If you are using the PASCO sensor, select the Easy Screen to get started. Four motion patterns will come up on the screen. Select one to start with. Press Run (when you are ready).
- Hold the board facing the motion sensor. (See
Figure 2-1
.) - Position yourself so you start at a distance of 1 meter from the screen. On the computer screen, you see a visual indicator or your position as a function of time.
- Adjust your position to match the pattern on the screen. (Note: you might be tempted to think that moving forward is positive, but this is not the case here. Moving backward results in
increasing
the distance between yourself and the motion sensor. As a result, for our purposes here, this is the
positive
direction.) - Repeat for each of the patterns available on the Easy Screen.
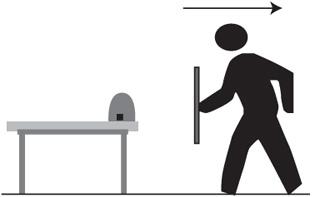
Figure 2-1
Matching a pattern using a motion sensor. Courtesy PASCO
.
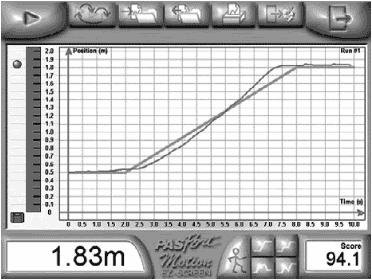
Figure 2-2
shows the result of someone moving backward and forward in such a way that they match the target motion pattern. This represents holding still for two seconds at 0.5 meters distance, then moving back at 2.2 m/s, and then holding still for another two seconds at a distance of 1.8 meters. The person doing the matching does not have to think about this, but only needs to look at the screen and move to fit the pattern.
Constant velocity
in the positive direction (which in this case is defined as
away
from the motion sensor) is represented by a
straight line
on a distance versus time graph.
The faster the motion, the steeper the slope
.