Full House (11 page)

These findings have led to all manner of speculation, some rather silly. For example, Whipp and Ward (1992) just extrapolate their curves and then defend the conclusion that women will eventually outrun men in most events, and rather soon for some. (The extrapolated curves for the marathon, for example, cross in 1998 when women should beat men by this argument.)
But extrapolation is a dangerous, generally invalid, and often foolish game. After all, as I said before, extrapolate the linear curve far enough and all distances will be run in zero and then in negative time. (False extrapolation also produces the irresponsible figures often cited for growth of human populations—in a few centuries, for example, humans will form a solid mass equal to the volume of the earth and no escape into outer space will be possible because the rate of increase will cause the diameter of this human sphere to grow at greater than the speed of light, which, as Einstein taught us, sets an upper bound upon rapidity of motion.) Clearly we will never run in negative time, nor will our sphere of solid humanity expand at light speed. Limits or right walls will be reached, and rates of increase will first slow and eventually stop.
Women may outclass men in certain events like ultra-long-distance swimming, where buoyancy and fat distribution favor women’s physiques and endurances over men’s (women already hold the absolute record for the English Channel and Catalina Island swims). The marathon may also be a possibility. But I doubt that women will ever capture either the 100-meter dash or the heavyweight lifting records. (Many women will always beat most men in any particular event—most women can beat me in virtually anything physical. But remember that we are talking of world records among the very best performers—and here the biomechanics of different construction will play determining role.)
The basic reason for more rapid gains (and less curve flattening) in women’s events seems clear. Sexism is the culprit, and happy reversals of these older injustices the reward. Most of these events have been opened to women only recently. Women have been brought into the world of professionalism, intense training, and stiff competition only in the last few years. Women, not so long ago (and still now for so many), were socialized to regard athletic performance as debarred to their gender—and many of the great women performers of the past, Babe Didrikson in particular, suffered the onus of wide dismissal as overly masculine. In other words, most women’s curves are now near the beginning of the sequence— in the early stages of rapid and linear improvement. These curves will flatten as women reach their own right walls—and only then will we know true equality of opportunity. Until then, the steep and linear improvement curves of women’s sports stand as a testimony to our past and present inequities.
9
0.400 Hitting Dies as the Right Tail Shrinks
Granting the foregoing argument that hitting must be improving in some absolute sense as the best athletes first rush, and then creep, toward the right wall of biomechanical limits on human performance, only one traditional explanation remains unrefuted for viewing the extinction of 0.400 hitting as the deterioration of something at bat—the possibility that, while hitting has improved, other opposing activities (pitching and fielding) have gotten better, even faster, leading to a relative decline in batting performance.
This last holdout of traditionalism fails the simplest and most obvious test of possible validity. If pitching and fielding have slowly won an upper hand over hitting, we should be able to measure this effect as a general decline in batting averages through the twentieth-century history of baseball. If mean batting averages have fallen with time, as pitching and fielding assert increasing domination, then the best hitters (the 0.400 men of yore) get dragged down along with the masses—that is, if the mean batting average were once 0.280, then a best of over 0.400 makes sense as an upper bound, but if the mean has now fallen to, say, 0.230, then 0.400 might stand too far from this declining mean for even the best to reach.
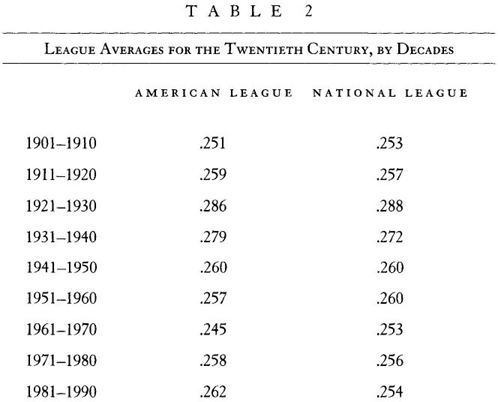
This entirely sensible explanation fails because, in fact, the mean batting average for everyday players has been rock-stable throughout our century (with interesting exceptions, discussed later, that prove the rule). Table 2 (page 102) presents decadal mean batting averages for all regular players in both leagues during the twentieth century. (I included only those players who averaged more than two at-bats per game for the entire season, thus eliminating weak-hitting pitchers and second-stringers hired for their skills in fielding or running.)
5
The mean batting average began at about 0.260, and has remained there throughout our century. (The sustained, though temporary, rise in the 1920s and 1930s presents a single and sensible exception, for reasons soon to come, but cannot provide an explanation for the subsequent decline of 0.400 hitting for two reasons: first, the greatest age of 0.400 hitting occurred before then, while averages stood at their usual level; second, not a soul hit over 0.400 throughout the 1930s, despite the high league means
—
I include Bill Terry’s 0.401 of 1930 itself in the 1920s calculation.) Thus our paradox only deepens: 0.400 hitting disappeared in the face of preserved constancy in average performance. Why should the best be trimmed, while ordinary Joes continue to perform as ever before? We must conclude that the extinction of 0.400 hitting does not reflect a general decline in batting prowess, either absolute or relative.
When issues reach impasses of this sort, we usually need to find an exit by reformulating the question—and reentering the field by another door. In this case, and following the general theme of my book, I suggest that we have been committing the deepest of all errors from the start of our long-standing debate about the decline of 0.400 hitting. We have erred— unconsciously to be sure, for we never considered an alternative—by treating "0.400 hitting" as a discrete and definable "thing," as an entity whose disappearance requires a special explanation. But 0.400 hitting is not an item like "Joe DiMaggio’s favorite bat," or even a separately definable class of objects like "improved fielders’ gloves of the 1990s." We should take a hint from the guiding theme of this book: the variation of a "full house" or complete system should be treated as the most compelling "basic" reality; averages and extreme values (as abstractions and unrepresentative instances respectively) often provide only partial, if not downright misleading, views of a totality’s behavior.
Hitting 0.400 is not an item or entity, a thing in itself. Each regular player compiles a personal batting average, and the totality of these averages may be depicted as a conventional frequency distribution, or bell curve. This distribution includes two tails for worst and best performances—and the tails are intrinsic parts of the full house, not detachable items with their own individuality. (Even if you could rip a tail off, where would you make the break ? The tails grade insensibly into the larger center of the distribution.) In this appropriately enlarged perspective, 0.400 hitting is the right tail of the full distribution of batting averages for all players, not in any sense a definable or detachable "thing unto itself." In fact, our propensity for recognizing such a category at all only arises as a psychological outcome of our quirky propensity for dividing smooth continua at numbers that sound "even" or "euphonious"—witness our excitement about the coming millennial transition, though the year 2000 promises no astronomical or cosmic difference from 1999 (see Gould, 1996, essay 2).
When we view 0.400 hitting properly as the right tail of a bell curve for all batting averages, then an entirely new form of explanation becomes possible for the first time. Bell curves can expand or contract as amounts of variation wax or wane. Suppose that a frequency distribution maintains the same mean value, but that variation diminishes symmetrically, with more individual measures near the mean and fewer at both the right and left tails. In that case, 0.400 hitting might then disappear entirely, while the mean batting average remained stable—but the cause would then reside in whatever set of reasons produced the shrinkage of variation around a constant mean. This different geometrical picture for the disappearance of 0.400 hitting does not specify a reason, but the new model forces us to reconsider the entire issue—for I can’t think of a reason why a general shrinkage of variation should record the worsening of anything. In fact, the opposite might be true: perhaps a general shrinkage of variation reflects improvement in the state of baseball. At the very least, this reformulation weans us from traditional, locked-in, and unproductive modes of explanation—in this case the "certainty" that extinction of 0.400 hitting must be recording a trend in the degeneration of batting skills. We are now free to consider new explanations: Why should variation be shrinking? Does shrinking record improvement or degeneration (or neither)—and, if so, of what?
Does this alternate explanation work? I have already documented the first part of the claim—preservation of relatively constant mean batting averages through time (see Table 2). But what about the second component? Has variation been shrinking symmetrically about this mean value during the history of twentieth-century baseball? Let me first demonstrate that mean batting averages have been stabilized by an active effort of rulemakers—for natural shrinkage about a purposely fixed point presents an appealing picture that, in my view, establishes our best argument for viewing 0.400 hitting as a predictable and inevitable consequence of general improvement in play.
Figure 14 presents mean batting averages for all regular players in both leagues year by year (the National League began in 1876, the American League in 1901). Note the numerous excursions in both directions, but invariable returns to the general 0.260 level. This average level has been actively maintained by judicious modification of the rules whenever hitting or pitching gained a temporary upper hand and threatened to disrupt the saintly stability of our national pastime. Consider all the major fluctuations:
After beginning at the "proper" balance, averages began to drift down, reaching the 0.240s during the late 1880s and early 1890s. In response, and in the last major change ever introduced in the fundamental structure of baseball (number 1 on Figure 14), the pitching mound retreated to its current distance of sixty feet six inches from the plate during the 1893 season. (The mound had begun at forty-five feet from the plate, with pitchers delivering the ball underhand, and had migrated steadily back during baseball’s early days—the reason for limited utility of nineteenth-century statistics in these calculations.) Unsurprisingly, hitters responded with their best year ever. The mean batting average soared to 0.307 in 1894, and remained high until 1901 (number 2 on Figure 14), when adoption of the foul-strike rule forced a rapid decline to propriety (foul balls had not previously been counted for strikes one and two). Averages remained anomalously low until introduction of the cork-centered ball prompted an abrupt rise in 1911 (number 3 in Figure 14). Pitchers quickly accommodated, and averages returned to their proper 0.260 level as the decade advanced.
The long excursion (number 4 on Figure 14), nearly twenty years of high hitting during the 1920s and 1930s, represents the one extended exception to a pattern of long stability interrupted by quick blips—and the fascinating circumstances and putative reasons have long been debated by all serious fans. In 1919, Babe Ruth hit a wildly unprecedented twenty-nine homers, more than most entire teams had garnered in full seasons before ; then, in 1920, he nearly doubled the total, to fifty-four. At all other times, the moguls of baseball would have reacted strongly to this unseemly change and would, no doubt, have reined in these Ruthian tendencies by some judicious change of rules. But 1920 represented the crux of a unique threat in the history of baseball. Several members of the 1919 Chicago White Sox (the contingent later known as the Black Sox), including the great 0.400 hitter Shoeless Joe Jackson, had accepted money from a gambling ring to throw the World Series of 1919. The resulting revelations almost destroyed professional baseball, and attendance declined precipitously during the 1920 season. The owners (whose pervasive stinginess had set the context that encouraged such admittedly dishonest and indefensible behavior) turned to Ruth as a deus ex machina. His new style of play packed in the crowds, and owners, for once, went with the flow and allowed the game to change radically. Scrappy, one-run-at-a-time, anyway-possible, savvy-baserunning, pitcher’s baseball became a style of the past (much to Ty Cobb’s permanent disgust); big offense and swinging for the fences became de rigueur. Mean batting averages rose abruptly and remained high for twenty years, even breaking 0.300 for the second (and only other) time in 1930.
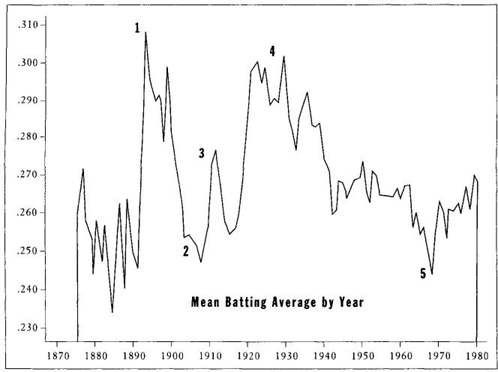
FIGURE 14 The mean batting average for regular major league players has remained quite steady at about 0.260 during the entire history of major league baseball. The few exceptions can be explained and were "corrected" by judicious changes in the rules. Averages rose after the pitching mound was moved back (1); declined after adoption of the foul-strike rule (2); rose again after the introduction of the cork-centered ball (3), and then again during the 1920s and ’30s (4). The decline in the 1960s (5) was reversed in 1969 by lowering the pitching mound and decreasing the strike zone.
But why were Ruth and other hitters able to perform so differently when circumstances encouraged such a change? Traditional wisdom—it is ever so, as we search for the "technological fix"—attributes this long plateau of exalted batting averages to introduction of a "lively ball." But Bill James, baseball’s greatest sabermetrician, argues (in his Historical Baseball Abstract, Villard Books, 1986) that no major fiddling with baseballs in 1920 can be proven. James suspects that balls did not change substantially, and that rising batting averages can be attributed to alterations in rules and attitudes that imposed multiple and simultaneous impediments upon pitching, thus upsetting the traditional balance for twenty years. All changes in practice favored hitters. Trick pitches were banned, and hurlers who had previously scuffed, shined, and spat on balls with abandon now had to hide their antics. Umpires began to supply shiny new balls whenever the slightest scuff or spot appeared. Soft, scratched, and darkened balls had previously remained in play as long as possible—fans even threw back foul balls (!), as they do today in Japan, except for home runs. James argues that the immediate replacement of soft and discolored by hard and shiny balls would do as much for improved hitting as any supposedly new construction of a more tightly wound, livelier ball.
In any case, averages returned to their conventional level in the 1940s as the war years siphoned off the best in all categories. Since then, only one interesting excursion has occurred (number 5 in Figure 14)—another fine illustration of the general principle, and recent enough to be well remembered by millions of fans. For reasons never determined, batting averages declined steadily throughout the 1960s, reaching a nadir in the great pitchers’ year of 1968, when Carl Yastrzemski won the American League batting title with a minimal 0.301, and Bob Gibson set his astonishing, off-scale record of a 1.12 earned run average (see page 127 for more on Gibson). So what did the moguls do? They changed the rules, of course—this time by lowering the pitching mound and decreasing the strike zone. In 1969, mean batting averages returned to their usual level— and have remained there ever since.