Full House (7 page)

FIGURE 4 A right-skewed distribution for time of death for an illness with a median mortality of eight months. Each individual must be considered as a separate entity and the entire distribution cannot be characterized by its median value.
THE SKEW OF A DISTRIBUTION. If we decide to treat variation as a principal reality, then we must consider the standard terms and pictures for portraying populations and their spread. We all know the conventional icon, called a frequency distribution, with the horizontal axis scaled as a graded series for the measure under consideration (height, weight, age, survivorship in disease, batting average, anatomical complexity, etc.), and the vertical axis scaled for the number of individuals in each interval of horizontal values (those weighing between ten and twenty pounds, between twenty and thirty, etc.; those between ten and fifteen years of age, between fifteen and twenty, etc.). Frequency distributions may be symmetrical— that is, with an identical shape and number on either side of the central tendency. The ubiquitous and idealized "normal distribution" or "bell curve" of current notoriety (Figure 5) is defined as symmetrical in this manner. We have all seen normal curves so often that we have been subtly led to treat natural systems as though they longed to display this ideal form. But most actual populations are not so simple or tidy. (Systems with purely random variation around a mean value will be symmetrical—as variation falls with equal probability on either side of the mean, with any single case more likely to lie close to the mean than far away. Runs of heads or tails in coin tossing, for example, form normal distributions. We regard the normal distribution as canonical because we tend to view systems as having idealized "correct" values, with random variation on either side—another consequence of lingering Platonism. But nature does not match our expectations very often.)
Actual distributions are often asymmetrical, or skewed. In a skewed distribution, as illustrated by my personal story, variation stretches out farther on one side than the other—called either "right" or "left" skewed depending on the direction of elongation (Figure 6). The reasons for skewing are often fascinating and full of insight about the nature of systems— for skewing measures departure from randomness. Since this book treats the nature of variation, and the reasons for changes in spread through time, skewing becomes an important principle in all my examples.

FIGURE 5 An idealized bell curve or normal frequency distribution, showing that all measures of central tendency (mean, median, and mode) coincide.
MEASURES OF CENTRAL TENDENCY AND THEIR MEANING. I have discussed the three standard measures of central tendency, or "average" value—the mean (or conventional average calculated by adding all values and dividing by the number of cases), the median (or halfway point), and the mode (or most common value). In symmetrical distributions, all three measures coincide — for the center is, simultaneously, the most common value, the halfway point (with equal numbers of cases on either side), and the mean. This coincidence, I suspect, has led most of us to ignore the vital differences among these measures, for we view "normal curves" as, well, normal—and regard skewed distributions (if we grasp the principle at all) as peculiar and probably rare. But measures of central tendency differ in skewed distributions—and a major source of employment for economic and political "spin doctors" lies in knowing which measure to choose as the best propaganda for the honchos who hired your gun.

FIGURE 6 Left- and right-skewed distributions.
I have already shown how the higher mean and lower mode of a right-skewed distribution in incomes can be so exploited (see page 37). In general, when a distribution is prominently skewed, mean values will be pulled most strongly in the direction of skew, medians less, and modes not at all. Thus, in right-skewed distributions, means generally have higher values than medians, and medians higher than modes. Figure 7 should make these relationships clear. If we start with a symmetrical distribution (with equal mean, median, and mode), and then pull the variation to form a right-skewed distribution, the mean will change most in the direction of skew—for one new millionaire on the right tail can balance hundreds of indigent people on the left tail. The median changes less, for a single pauper will now compensate the millionaire when we are only counting noses on either side of a central tendency. (The median might not move at all if only the wealth, and not the number, of people increases on the right side of the distribution. But if the number of wealthy people at the right tail increases as well, then the median will also shift to the right— but not so far as the mean.) The mode, meanwhile, may well stay put and not vary at all, as mean and median grow in an increasingly right-skewed distribution. Twenty thousand per year may remain the most common income, even while the number of wealthy people constantly increases.
"WALLS," OR LIMITS TO THE SPREAD OF VARIATION. As a major reason for skew, variation is often limited in the extent of potential spread in one direction (but much freer to expand in the other). The reasons for such limits may be trivial or logical—as in my cancer story where a person can’t die of mesothelioma before he gets the disease, and zero time between onset and death therefore becomes an irreducible minimum. The reasons may also be subtle and more interesting—as in the examples of batting averages and life’s history to be presented in Parts Three and Four of this book.
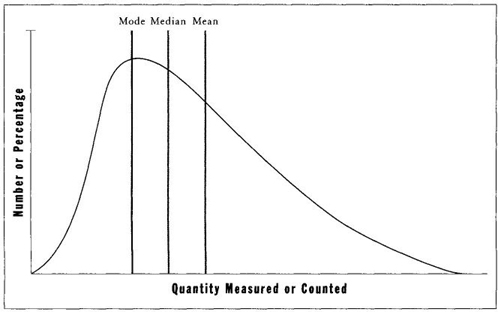
FIGURE 7 In a right-skewed distribution, measures of central tendency do not coincide. The median lies to the right of the mode, and the mean lies to the right of both other measures.
In either case, such limits often produce skewed distributions, because variation can expand in only one direction—you can’t die of mesothelioma before you get it, but you can live for years and years after a diagnosis. With an eight-month median mortality, and a rigid lower limit at time zero, how could the distribution of deaths be anything but strongly right skewed?
Throughout this book, I shall refer to such limits upon the spread of variation as "walls"—either "right walls" or "left walls" depending upon their position. Left walls induce right-skewed distributions (for variation is only free to expand away from a wall); right walls provoke left-skewed distributions. The left wall of my cancer story leads to a right-skewed distribution of deaths.
(I have considered the cultural bias involved in the largely arbitrary designation of right as the direction for higher values, left for lower— though, depending upon the example, lower may be judged better, as in distributions for weight in our diet-conscious society. I suppose that we fall into this bias for two reasons, one insidious and the other benign. Prejudice against our left-handed minority—an old and probably universal feature of human cultures, I fear—must set the major reason. Jesus sits ad dextram patris, at the right hand of the father. Right, etymologically, is dextrous—and "law" is droit in French and Recht in German, both meaning right. Left is both sinister and gauche. For the benign reason, we read from left to right and therefore conceptualize growth and increase in this direction. Were I writing this book in Israel, which also has a right-handed majority, I might think of left walls as directions of increase. Were I writing in Japan, I might be talking of top and bottom walls. So be it.)
Readers need to grasp only these three nontaxing concepts about the nature of variation in order to render all the examples of this book fully digestible—right and left walls as limits to the spread of variation; right-and left-skewed distributions arising as results of these limits; and differences among means, medians, and modes as measures of central tendency.
5
Case Two: Life’s Little Joke
Genuine changes in central tendency are meaningful, but our failure to consider variation has led to a backwards interpretation: the evolution of horses
The most erroneous stories are those we think we know best—and therefore never scrutinize or question. Ask anyone to name the most familiar of all evolutionary series and you will almost surely receive, as an answer: horses, of course. The phyletic racecourse from small, many-toed protohorses with the charming name eohippus, to a big, single-toed Clydesdale hauling the Budweiser truck, or Man O’ War thundering down the stretch, must be the most pervasive of all evolutionary icons. Does any major museum not have a linear series of cases against a long wall, or up the center of a main hall, one skeleton in each, and all illustrating the triumphant trend?
This horse story also represents the oldest of established evolutionary series—a major reason for its fame. Thomas Henry Huxley himself, Darwin’s most celebrated supporter, first proposed the sequence from European fossils in 1870. This original version did not long survive because Huxley’s three European fossils, linked as an evolutionary series, actually represent three separate migrations of American stocks, with extinction in Europe following each incursion. Meanwhile, the full story was unfolding in America.
In 1876, Huxley made his only voyage to the United States, primarily to participate in celebrations for our Centennial and, in particular, to give the principal address at the founding of Johns Hopkins University. He visited Othniel C. Marsh, America’s leading vertebrate paleontologist, to see the magnificent series of fossil horses that Marsh had gathered in the American West. Marsh convinced him that the American series formed a true evolutionary main line, with the European offshoots as disconnected side branches. Huxley had to scramble, for he had promised to give a lecture in New York, just a few weeks later, on fossil horses—and he now had to revise his story completely.
Marsh agreed to help with these quick changes, and he prepared a famous chart for Huxley’s use in the New York lecture (reproduced here as Figure 8). This figure, among the most celebrated in the history of science, shows two of the three major trends in our classic tale: (1) reduction in number of toes, from four on the front feet and three behind in the earliest horses (bottom of the figure), to three functional toes, to a central toe with two shortened side toes, to a single toe with two side splints as vestiges of former toes (modern horses at top of the figure); (2) steady increase in the height of molar teeth (fifth column of specimens) with elaboration in the convolutions of their cusps (columns six and seven). Marsh chose to draw all his specimens at the same size, and therefore didn’t show the third and most evident trend of marked increase in bulk from the initial stage (which he described as cat-sized, though fox terriers have since triumphed as a canonical metaphor—see Gould, 1991) to the massive Clydesdale of today. Later versions showed all three coordinated trends, as in the best-known figure by the next generation’s paleontological leader, William D. Matthew, first published early in our century in a pamphlet by the American Museum of Natural History, still for sale in the museum shop during my youth in the 1950s, and endlessly reproduced all along. (One copy, for example, appeared in the textbook used by John Scopes to teach evolution to the schoolchildren of Dayton, Tennessee—a source, therefore, for W. J. Bryan’s fulminations at Scopes’s famous "monkey" trial—"no more repulsive doctrine was ever proclaimed by man.") This version arranges the specimens in stratigraphic order next to a geological column and shows all trends of size, toes, and teeth (Figure 9).
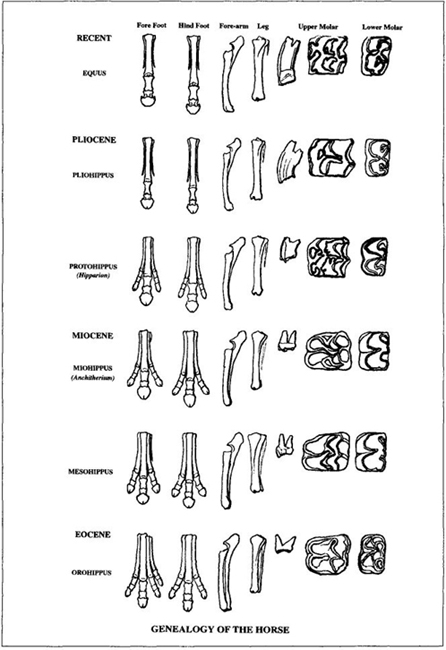
FIGURE 8 A famous chart on the evolution of horses prepared by O. C. Marsh for T. H. Huxley’s New York lecture. Note the linear march to progress in all characters.

FIGURE 9 W. D. Matthew’s linear and progressive evolution of horses plotted in stratigraphic order, showing increasing body size, decreasing number of toes, and increasing height of teeth.
In some legitimate though limited sense, these trends are true. The first horses, technically called Hyracotherium (though I love the informal, if taxonomically incorrect, name eohippus, or "dawn horse"), were small, and did have four toes in front, three behind, and low-crowned teeth. The standard story for the advantages of these trends—probably also basically correct—points to a switch in habitat from browsing in forested areas (where many toes hug the soft ground and low-crowned teeth can manage the leafy vegetation) to grazing on plains (where hooves are superior on the hard terrain, and strong, high-crowned teeth deal better with tough grasses and their substantial content of silica. Grasses first evolved in the midst of equine evolution, thus promoting these trends by opening up an extensive new habitat.) In a strictly join-the-dots sense, we do make a correct statement about genealogy when we connect the point for Hyracotherium with the point for modern Equus (the only living genus of horses, including eight species—three zebras, four donkeys and asses, and Old Dobbin, or Equus caballus, representing true horses alone).
So far, so good—but (as I shall show) so very limited, and so misleading. The lineage of Hyracotherium to Equus represents only one pathway through a very elaborate bush of evolution that waxed and waned in a remarkably complex pattern through the last 55 million years. This particular pathway cannot be interpreted as a summary of the bush; or as an epitome of the larger story; or, in any legitimate sense, as a central tendency in equine evolution. We have chosen this little sample of a totality for one reason alone: Equus is the only living genus of horses, and therefore the only modern animal that can serve as an endpoint for a series. If you are committed to depicting the evolution of any living group as a single pathway from an ancestral point to an item of current glory, then I suppose that the story must be told in this conventional way. But when we consider more comprehensive models of evolution, we must call such pictures into question.
We therefore arrive at my favorite subject of ladders versus bushes, or, in the context of this book, individual pathways chosen with prejudice versus entire systems (full houses) and their complete variation. As the Bible says about wisdom, so too may we state about the proper iconography of evolution: "She is a tree of life to them that lay hold upon her." Evolution rarely proceeds by the transformation of a single population from one stage to the next. Such an evolutionary style, technically called anagenesis, would permit a ladder, a chain, or some similar metaphor of linearity to serve as a proper icon of change. Instead, evolution proceeds by an elaborate and complex series of branching events, or episodes of speciation (technically called cladogenesis, or branch-making). A trend is not a march along a path, but a complex series of transfers, or side steps, from one event of speciation to another. The evolutionary bush of horses includes many terminal tips, and each leads back to Hyracotherium through a labyrinth of branching events. No route to Hyracotherium is straight, and none of the numerous labyrinthine paths has any special claim to centrality (see Figure 10). We run a steamroller right over a fascinatingly complex terrain when we follow the iconographic convention for displaying the pathway from Hyracotherium to Equus as a straight line.
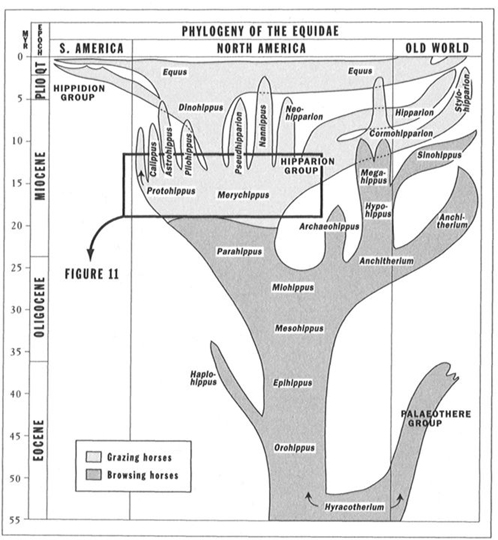
FIGURE 10 The more complex branching evolution of horses as depicted by Bruce MacFadden in 1988.
So why do we engage in such distortion, and why have horses become the standard example of an evolutionary "trend"? At this point in the argument, we encounter the irony that I have called "life’s little joke" (see Gould, 1987). We choose horses because their living species represent the endpoint of such an unsuccessful lineage. The situation is even "worse," and fully subject to generalization: our bias against considering the variation of full systems, and trying instead to depict trends as "entities moving somewhere," virtually guarantees that all our standard examples of evolutionary movement and "progress" must feature failing groups, so reduced from earlier bushiness that only a single twig—life’s little joke—survives as a relic of former glory.
What are the real success stories of mammalian evolution? We can answer this question without ambiguity, at least in terms of numerous species and vigorous radiation: rats, bats, and antelopes (or, in more formal terms, the orders Rodentia, Chiroptera, and the family Bovidae among the artiodactyls). These three groups dominate the world of mammals, both in numbers and in ecological spread. Yet has anyone ever seen an iconographic depiction of their success?
We never feature these groups because we do not know how to draw their triumph. Evolution, to us, is a linear series of creatures getting bigger, fancier, or at least better adapted to local environments. When groups are truly successful, and their tree contains numerous branches, all prospering at once, we can designate no preferred pathway—and we therefore have no convention for depicting, or even (really) for conceiving, their evolution. But when an evolutionary bush has been so pruned by extinction that only one lineage survives—a twig from an earlier arborescence, a sliver of former copiousness—then we can fool ourselves into viewing this tiny remnant as a unique culmination. We either forget that other pathways to extinct lineages once existed, or we scorn them as "dead ends"—irrelevant side branches from a supposed main trunk. We then bring forth our conceptual steamroller to straighten out the little path from the surviving twig to the ancestral stock—and, finally, with the positive spin of a consummate evolutionary trendmaker, we praise the progress of horses.
Many classic "trends" of evolution are stories of such unsuccessful groups—trees pruned to single twigs, then falsely viewed as culminations rather than lingering vestiges of former robustness. We cannot grasp the irony of life’s little joke until we recognize the primacy of variation within complete systems, and the derivative nature of abstractions or exemplars chosen to represent this varied totality. The full evolutionary bush of horses is a complete system; the steamrollered "line" from Hyracotherium to Equus is one labyrinthine path among many, with no special claim beyond the fortuity of a barely continued existence.
These conceptual errors have plagued the interpretation of horses, and the more general evolutionary messages supposedly conveyed by them, from the very beginning. Huxley himself, in the printed version of his capitulation to Marsh’s interpretation of horses as an American tale, used the supposed ladder of horses as a formal model for all vertebrates. For example, he denigrated the teleosts (modern bony fishes) as dead ends without issue (1880, page 661): "They appear to me to be off the main line of evolution—to represent, as it were, side tracks starting from certain points of that line." But teleosts are the most successful of all vertebrate groups. Nearly 50 percent of all vertebrate species are teleosts. They stock the world’s oceans, lakes, and rivers, and include nearly one hundred times as many species as primates (and about five times more than all mammals combined). How can we call them "off the main line" just because we can trace our own pathway back to common ancestry with theirs, more than 300 million years ago?