Full House (17 page)

Let us, then, following the procedure advocated throughout this book, portray the full range of variation through time in all three acts (Figure 23, based on data for first appearances of 377 species, supplied to me by Richard Norris of the Woods Hole Oceanographic Institution, and used by me in a technical paper published in 1988). Just as 0.400 hitting is not an independent "thing," but rather the right tail of the bell curve for batting averages, so too must we view the largest foram as an extreme value in a full distribution, not as an entity unto itself. When we consider the entire system, new modes of interpretation must be explored.
All traditional interpretations of Cope’s Rule have been framed in terms of supposed evolutionary advantages for larger bodies. I mean, how else could one possibly proceed? Body size clearly increases as a generality, so we must figure out why larger bodies are better. A recent article on Cope’s Rule makes this "obvious" point clearly and bluntly (Hallam, 1990, page 264):
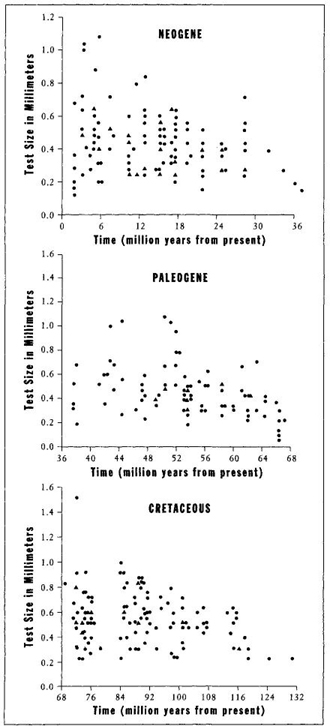
FIGURE 23 Size at first appearance for species of planktonic forams during their three evolutionary radiations. Note that species start small (right-hand side of each graph) in each interval—and that many species remain small while the range increases in each interval.
Since phyletic size increase is such a widespread trend in the animal kingdom, there must be manifestly one or more selective advantages of larger size.
Traditional strategies then continue by proposing (often by speculation, or at least without consideration of alternatives) a short list of advantages that would lead natural selection to favor large bodies in most cases. Hallam continues from the quotation above (with reasons better suited to large multicellular animals than to forams):
Among those proposed are an improved ability to capture prey or ward off predators; greater reproductive success; increased regulation of the internal environment; and increased heat regulation per unit volume.
Another recent article, titled "Body size, ecological dominance, and Cope’s rule" (Brown and Maurer, 1986, page 250), proposes a most important benefit of all: "Presumably the ecological advantage of monopolizing resources provides the selective pressure that promotes evolution of greater size. Individuals of large size are favored by ... natural selection, because they can dominate resources use and consequently leave more offspring than their smaller relatives."
I do confess to great discomfort when I see such words as "manifestly," or even "presumably," attached to conclusions stated without compelling logic or evidence (or subject to another interpretation simply not conceptualized by the author). I am reminded of the chilling line that Wilson attributed to Peirce (as quoted in chapter 2): "Let us not pretend to deny in our philosophy what we know in our hearts to be true." Such protestations of the "obvious" stymie thought; the non-obvious is so often true— and, when true, usually enormously interesting (if only for the power of breaking through old prejudices). Figure 22 is a myopically misleading picture with two "manifest" features that need not be true: an "obvious" evolutionary trend to increased body size, with a "necessary" implication that the selective advantages of such an increase must cause the trend.
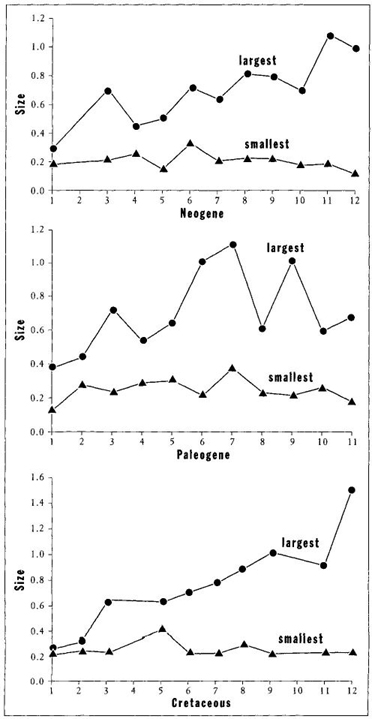
FIGURE 24 Although size of the largest species tends to increase in each of the three radiations of forams, the size of the smallest species either remains constant or decreases. Therefore the main trend is toward an increase in variation of size, not a directional movement.
The full variation of Figure 23 shows an increase through time of the largest species, but no general trend for the entire lineage. Small species continue to exist and flourish (see Figure 24 for histories of smallest and largest on the same chart for each act). If we must talk of "trends" at all, should we not notice and emphasize the increasing range of variation in size during each act? At each of the three beginnings, evolution starts with a few founding lineages at small body size. The range then increases through time. Small species continue to flourish (and always constitute the largest fraction of species), while the range of size for all species expands. How can we say that larger size holds an absolute advantage, when most species remain small?
A supporter of traditional interpretations for Cope’s Rule might reply, "Yes, I see your point about the continuity of small species. But some species get bigger, while none get smaller than the founding lineages. So some (at least statistical) advantage for large size must exist." Fine, except for one point and a key theme of this book: walls.
Remember the wall in the drunkard’s walk. His random motion could accumulate in only one direction because he started at a wall that he couldn’t penetrate. Remember the wall in 0.400 hitting. The best batter cannot penetrate the right wall of human limitation—so he must stay in the same spot, hands against the wall, while the mean player sneaks up upon him, leading to a reduction in his batting average for the same performance. Can we talk about a similar wall in the evolution of planktonic forams?
We now come to the curious point that makes this example so compelling—for we could not possibly imagine a more undeniable wall than the lower limit of body size for planktonic forams. I say this with some cynicism because this wall is entirely an artifact of an arbitrary human decision, not a dictate of nature at all. But what could be more clearly definable than an arbitrary decision of art?
Forams are nearly (or actually) microscopic. They cannot be collected by unaided visual inspection. Planktonic forams exist in multitudes within marine sediment. They are recovered for study by disaggregating the sediment and washing it through a stacked series of sieves, with decreasing mesh size from top to bottom. Thus the largest particles get trapped in the upper sieve, while particles smaller than the mesh of the lowest sieve get washed down the drain. Traditionally, although practices do vary somewhat among laboratories, the smallest sieve has a mesh size of 150 micrometers. Ifforams smaller than 150 micrometers exist (and they do), they end up in the sink and do not appear in our figures. A size of 150 micrometers therefore operates as a true left wall of minimal dimensions for the evolution of forams. If founding lineages begin near this left wall— and they do in all three acts—then nothing can get any smaller later in the act.
The existence of this left wall forces a reevaluation of the entire story. Need we postulate any more than the presence of this wall, and the beginning of each act in its vicinity, to render the apparent trend? Need we say anything about the putative advantages of large size at all? Only one direction of change lies open. Forams cannot get any smaller than their beginnings, but many species retain this initial size and continue to flourish. Others expand into the only open space.
We shouldn’t deny an impetus to large size just because some species remain small. Perhaps just a few stragglers retain the starting dimensions, while most follow Cope’s Rule for conventional reasons of "bigger is better." But two additional kinds of evidence strongly argue against this last possibility for viewing the play of planktonic forams as a story of repeated benefits for larger species.
First let us consider the history of size for the most appropriate measure of an "average" species in each act—for if this "average" tends to increase, then maybe we should view larger size as a property of the whole. In chapter 4, I listed three major statistics for calculating an average— mean, median, and mode—and I discussed occasions when one or the other cannot be deemed appropriate. In particular, means and medians can give false impressions in highly skewed distributions—for both these measures will be pulled strongly in the direction of skew (the mean more than the median), even if very few individuals occupy the extended tail of the skewed distribution. If this general statement seems overly abstract, recall the discussion of the bell curve for incomes—a strongly right-skewed distribution because a few Bill Gateses make a billion bucks a year, while a left wall stands at no income at all. Thus, a whole lot of folks have to be gathered between the left wall of zero and the mean family income of about $30,000 per year—while the right tail extends out almost forever to Gates and (a very limited) company.
The mean is a terrible measure for any vernacular notion of "average" or "central tendency" in such a highly skewed distribution, because the introduction of just one Bill Gates will pull the mean way to the right—for his billion dollars to the right of the mean counts as much as 100,000 people making $10,000 to the left of the mean. The mean of such a highly skewed distribution therefore moves far away from the peak of the most frequent value—and ends up on the bell curve’s flank in the direction of skew (see Figure 7 for a graphic illustration and fuller discussion of this important principle). The median is not so badly pulled as the mean, but the median also ends up too far from the bell curve’s peak and on the skewed flank of the distribution (again, see Figure 7 and the accompanying discussion).
This artifact severely distorts our interpretation of a figure like 22, where we want to read the steady rise of mean values as a sure sign of general increase in size (according to Cope’s Rule) for the whole group of planktonic forams—whereas such a rise could also just indicate that a bell curve with an unchanging peak value has become progressively more right skewed with time. For highly skewed distributions, we therefore generally favor the third major measure of central tendency—the mode, or most common value (that is, the peak value of the bell curve itself).
I therefore divided the total range of variation attained within each act into ten equal intervals, and I plotted the interval occupied by the most species (I called this interval the "modal decade") for each of twelve equal time units in each of the three acts. I show my results in Figure 25. For this preferred measure of mode, we find no tendency whatsoever for increase in size through time in any act. (The Cretaceous act does increase a bit for the first three intervals, but then remains steady; the Paleogene act decreases in size of modal decade near the end; the Neogene act stays pretty steady throughout.) In other words, the most common of all sizes does not change substantially—either up or down—during any of the three episodes in the evolution of planktonic forams.
As a second, and clinching, piece of evidence, I dearly desired one more tabulation that was not available to me when I did my study in 1988—for I did not know the actual sequence of ancestor-descendant pairings. We want to learn whether any tendency exists for descendant species to arise at a larger size than their immediate ancestors—for if decreases in size are as common as increases in known evolutionary transitions, then we surely cannot talk meaningfully about an "impetus" or "trend" to size increase, even if the size of the largest species, or the inappropriate mean value, gets larger as the full distribution becomes progressively right skewed through time.
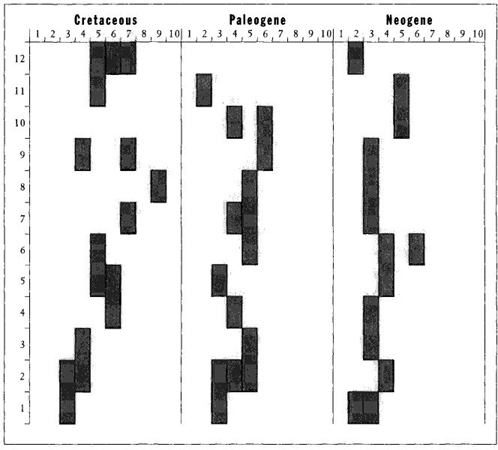
FIGURE 25 Change in the most frequently encountered size (small on left, large on right) during the three radiations of planktonic forams from oldest (bottom) to youngest (top). More than one shaded area at any time indicates equal frequencies for the shaded size classes. Note that, except for an initial size increase in the Cretaceous, the most common size shows no tendency to increase in any of the three radiations.