Just Tell Me I Can't (28 page)
Read Just Tell Me I Can't Online
Authors: Jamie Moyer


In 2009, St. Joseph's University recognized the work of the Moyer Foundation and granted Karen and Jamie honorary degrees as Doctors of Public Service.

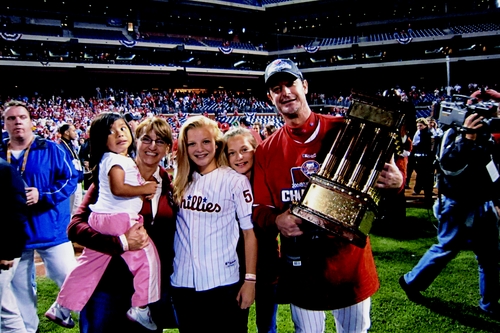
Celebrating on the field with (L to R) Katilina, sister Jill, Timoney, and Duffy.

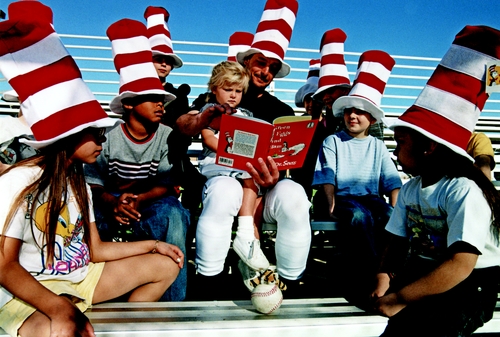
With eight kids at home, Moyer, pictured here as a Seattle Mariner on Literacy Day in the late '90s, is a veteran when it comes to reading Dr. Seuss.

The Family Moyer, Summer 2013. L to R, front: Yenifer, Katilina, Grady, and McCabe. L to R, back: Timoney, Duffy, Dillon, Karen, Jamie, and Hutton.

At forty-nine, Moyer came back from Tommy John surgery to pitch for the Colorado Rockies early in the 2012 season. (Courtesy Colorado Rockies)

Thanking the fans after becoming the oldest pitcher to ever win a major league game. (Courtesy Colorado Rockies)

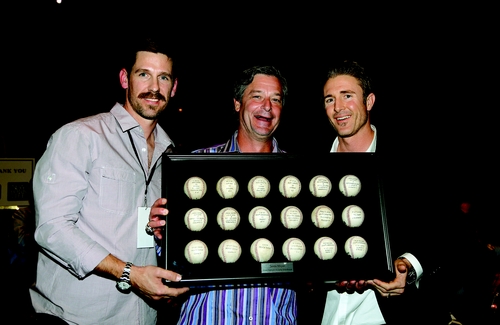
At Moyer's fiftieth birthday bash benefiting the Moyer Foundation, his former teammate Cliff Lee (left), pictured here with fellow Phillie Chase Utley, bid $20,000 for a collection of autographed Moyer game balls. (Courtesy the Moyer Foundation)

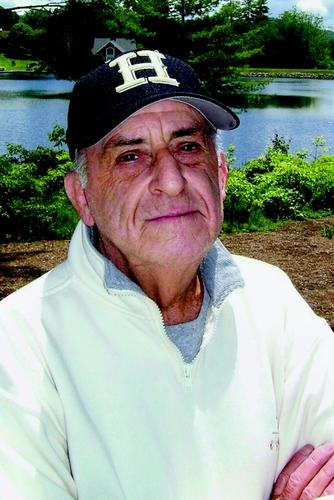
Moyer can still hear the voice of his late mentor Harvey Dorfman: “What are you going to do about it, kid?” (Courtesy Anita Dorfman)
- Scott Brosius
: .146 (7 for 48), 16 K's. “For some reason, when Scott came to the plate, I was very comfortable. I felt like I could throw my changeup to him anytime I wanted and get a lot of weak pop-ups or rollover ground balls to third. I'd catch him in between a lot: he'd be covering away, and I'd throw in. He had a tough time staying back and waiting on the change.” - Lance Berkman
: .083 (1 for 12), 5 K's. “Lance was a switch hitter who had more power as a lefty than on the right side of the plate, where he'd bat against me. I'd rock him back and forth: in and away, in and away. Like Scott, he had a tough time not jumping out at the changeup. When guys complained that I threw too slow, that's what I liked to hear.” - Cecil Fielder
: .189 (7 for 37), 1 HR, 3 RBI, 10 K's. “He had a long swing with his arms extended. He'd chase the ball when it was off the plate. I'd throw him a lot of changeups away, and when my catcher and I thought we could get inside, I'd get in under his hands and tie him up for a swing and a miss. The key was to throw him pitches that looked like strikes but that weren't when they got to the plate.” - Glenn Wilson
: .120 (3 for 25), 6 K's. “Glenn was a good mistake hitter. You'd have to be careful coming inside to him. He'd hurt you if you got too much of the plate. I'd get him to roll over on the changeup a lot.” - Kirby Puckett
: .176 (3 for 17). “His strike zone was from his shoelaces to his chin. He was a free swingerâwhich I liked to seeâwith real power, and short arms. Throw him a short curveball at his shoe tops and he'll chase it. If I went inside against him, I'd have to get in deep. Anything middle-in, he'd make you pay.”Â
- Wade Boggs
: Hit .382 (21 for 55) versus Moyer with two home runs and eight RBI. “Wade had one of the best eyes at the plate I've ever seen,” Moyer says. “He knew the strike zone and was disciplined about it. He didn't care if the count was 0â2 or 2â2. He had a plan and he was going to execute.” - Mark Kotsay
: .583 (21 for 36) with an OPS of 1.451. “He covered both sides of the plate very well off me and didn't try to do too much, other than hit the ball where it was pitched. He had an uncanny knack to square the ball up. And on occasion, he'd lay down a bunt just to keep me honest.” - Mike Schmidt
: .444 (12 for 27), 2 HR, 9 RBI, .704 SLG. “He was in his prime and I was young and inexperienced when I faced him. He took advantage of that. I had to prove I was going to beat him on the inner half of the plate, and at that time I didn't have the confidence to do that. He wouldn't panic. He knew he was going to get a pitch to hit.” - Bernie Williams
: .389 (35 for 90), 8 HR, 21 RBI, 1.245 OPS. “As a young player in the minors, Bernie didn't really know how to hit. But he grew into a very good hitter with power. I faced him in a lot of really tight situations, often with runners on, and he always had a good at-bat. He'd sit on a pitch until you threw it to him.” - Manny Ramirez
: .352 (19 for 54), 10 HR, 21 RBI, .963 SLG, 1.389 OPS. “Another one of those guys who would just sit on a pitchâsometimes for a whole day. If he got it, he'd hit it hard. He was a great mistake hitter. Back in his Cleveland days, every borderline pitch seemed to be called in his favor. Frustrating.”Â
| Year | Team | GP | GS | IP | WâL | HR | BB | SO | WHIP | ERA |
| 1986 | Cubs | 16 | 16 | 87.1 | 7â4 | 10 | 42 | 45 | 1.71 | 5.05 |
| 1987 | Cubs | 35 | 35 | 201 | 12â15 | 28 | 97 | 147 | 1.53 | 5.10 |
| 1988 | Cubs | 34 | 30 | 202 | 9â15 | 20 | 55 | 121 | 1.32 | 3.48 |
| 1989 | Tex | 15 | 15 | 76 | 4â9 | 10 | 33 | 44 | 1.54 | 4.86 |
| 1990 | Tex | 33 | 10 | 102.1 | 2â6 | 6 | 39 | 58 | 1.50 | 4.66 |
| 1991 | St L | 8 | 7 | 31.1 | 0â5 | 5 | 16 | 20 | 1.72 | 5.74 |
| 1993 | Bal | 25 | 25 | 152 | 12â9 | 11 | 38 | 90 | 1.26 | 3.43 |
| 1994 | Bal | 23 | 23 | 149 | 5â7 | 23 | 38 | 87 | 1.32 | 4.77 |
| 1995 | Bal | 27 | 18 | 115.2 | 8â6 | 18 | 30 | 65 | 1.27 | 5.21 |
| 1996 | Bos | 23 | 10 | 90 | 7â1 | 14 | 27 | 50 | 1.53 | 4.50 |
| 1996 | Sea | 11 | 11 | 70.2 | 6â2 | 9 | 19 | 29 | 1.20 | 3.31 |
| 1996 | TOT | 34 | 21 | 160.2 | 13â3 | 23 | 46 | 79 | 1.39 | 3.98 |
| 1997 | Sea | 30 | 30 | 188.2 | 17â5 | 24 | 43 | 113 | 1.22 | 3.86 |
| 1998 | Sea | 34 | 34 | 234.1 | 15â9 | 23 | 42 | 158 | 1.18 | 3.53 |
| 1999 | Sea | 32 | 32 | 228 | 14â8 | 23 | 48 | 137 | 1.24 | 3.87 |
| 2000 | Sea | 26 | 26 | 154 | 13â10 | 22 | 53 | 98 | 1.47 | 5.49 |
| 2001 | Sea | 33 | 33 | 209.2 | 20â6 | 24 | 44 | 119 | 1.10 | 3.43 |
| 2002 | Sea | 34 | 34 | 230.2 | 13â8 | 28 | 50 | 147 | 1.08 | 3.32 |
| 2003 | Sea | 33 | 33 | 215 | 21â7 | 19 | 66 | 129 | 1.23 | 3.27 |
| 2004 | Sea | 34 | 33 | 202 | 7â13 | 44 | 63 | 125 | 1.39 | 5.21 |
| 2005 | Sea | 32 | 32 | 200 | 13â7 | 23 | 52 | 102 | 1.39 | 4.28 |
| 2006 | Sea | 25 | 25 | 160 | 6â12 | 25 | 44 | 82 | 1.39 | 4.39 |
| 2006 | Phi | 8 | 8 | 51.1 | 5â2 | 8 | 7 | 26 | 1.09 | 4.03 |
| 2006 | TOT | 33 | 33 | 211.1 | 11â14 | 33 | 51 | 108 | 1.32 | 4.30 |
| 2007 | Phi | 33 | 33 | 199.1 | 14â12 | 30 | 66 | 133 | 1.44 | 5.01 |
| 2008 | Phi | 33 | 33 | 196.1 | 16â7 | 20 | 62 | 123 | 1.33 | 3.71 |
| 2009 | Phi | 30 | 25 | 162 | 12â10 | 27 | 43 | 94 | 1.36 | 4.94 |
| 2010 | Phi | 19 | 19 | 111.2 | 9â9 | 20 | 20 | 63 | 1.10 | 4.84 |
| 2012 | Col | 10 | 10 | 53.2 | 2â5 | 11 | 18 | 36 | 1.73 | 5.70 |
| TOT | Â | 696 | 638 | 4074 | 269â209 | 522 | 1155 | 2441 | 1.32 | 4.25 |
| Year | Team | GP | GS | IP | WâL | HR | BB | SO | WHIP | ERA |
| 1997 | Sea | 1 | 1 | 4.2 | 0â1 | 1 | 1 | 2 | 1.29 | 5.79 |
| 2001 | Sea | 3 | 3 | 19 | 3â0 | 1 | 3 | 15 | 0.79 | 1.89 |
| 2007 | Phi | 1 | 1 | 6 | 0â0 | 0 | 2 | 2 | 1.17 | 1.50 |
| 2008 | Phi | 3 | 3 | 11.2 | 0â2 | 1 | 4 | 10 | 1.63 | 8.49 |
| TOT | Â | 8 | 8 | 41.1 | 3â3 | 3 | 10 | 29 | 1.14 | 4.14 |
| Year | Team | GP | GS | IP | WâL | HR | BB | SO | WHIP | ERA |
| 1984 | Geneva (Aâ) | 14 | 14 | 104.2 | 9â3 | 5 | 31 | 120 | 0.860 | 1.89 |
| 1985 | Wnstn/Slm (A) | 12 | 12 | 94 | 8â2 | 1 | 22 | 94 | 1.106 | 2.30 |
| 1985 | Pttsfield (AA) | 15 | 15 | 96.2 | 7â6 | 4 | 32 | 51 | 1.355 | 3.72 |
| 1985 | TOT | 27 | 27 | 190.2 | 15â8 | 5 | 54 | 145 | 1.233 | 3.02 |
| 1986 | Pttsfield (AA) | 6 | 6 | 41 | 3â1 | 2 | 16 | 42 | 1.049 | 0.88 |
| 1986 | Iowa (AAA) | 6 | 6 | 42.1 | 3â2 | 2 | 11 | 25 | 0.850 | 2.55 |
| 1986 | TOT | 12 | 12 | 83.1 | 6â3 | 4 | 27 | 67 | 0.948 | 1.73 |
| 1989 | Rangers (RK) | 3 | 3 | 11 | 1â0 | 0 | 1 | 18 | 0.818 | 1.64 |
| 1989 | Tulsa (AA) | 2 | 2 | 12.1 | 1â1 | 1 | 3 | 9 | 1.541 | 5.11 |
| 1989 | TOT | 5 | 5 | 23.1 | 2â1 | 1 | 4 | 27 | 1.200 | 3.47 |
| 1991 | Lville (AAA) | 20 | 20 | 125.2 | 5â10 | 16 | 43 | 69 | 1.337 | 3.80 |
| 1992 | Toledo (AAA) | 21 | 20 | 138.2 | 10â8 | 8 | Â 37 | 80 | 1.190 | 2.86 |
| 1993 | Roch (AAA) | 8 | 8 | 54 | 6â0 | 2 | 13 | 41 | 1.019 | 1.67 |
| 1997 | Tacoma (AAA) | 1 | 1 | 5 | 1â0 | 0 | 0 | 6 | 0.200 | 0.00 |
| 2012 | Norfolk (AAA) | 3 | 3 | 16 | 1â1 | 1 | 0 | 16 | 0.688 | 1.69 |
| 2012 | Vegas (AAA) | 2 | 2 | 11 | 1â1 | 3 | 3 | 9 | 1.818 | 8.18 |
| 2012 | TOT | 5 | 5 | 27 | 2â2 | 4 | 3 | 25 | 1.148 | 4.33 |
| TOT | Â | 113 | 112 | 752.1 | 56â35 | 45 | 212 | 580 | 1.132 | 2.76 |