Read The Soundscape: Our Sonic Environment And The Tuning Of The World Online
Authors: R. Murray Schafer
The Soundscape: Our Sonic Environment And The Tuning Of The World (23 page)

Sound is in more intimate proximity to the listener in the right-hand column. Let us move the sound source closer still. The ultimate private acoustic space is produced with headphone listening, for messages received on earphones are always private property. “Head-space” is a popular expression with the young, referring to the geography of the mind, which can be reached by no telescope. Drugs and music are the means of invoking entry. In the head-space of earphone listening, the sounds not only circulate around the listener, they literally seem to emanate from points in the cranium itself, as if the archetypes of the unconscious were in conversation. There is a clear resemblance here to the functioning of Nada Yoga in which interiorized sound (vibration) removes the individual from this world and elevates him toward higher spheres of existence. When the yogi recites his mantra, he
feels
the sound surge through his body. His nose rattles. He vibrates with dark, narcotic powers. Similarly, when sound is conducted directly through the skull of the headphone listener, he is no longer regarding events on the acoustic horizon; no longer is he surrounded by a sphere of moving elements. He
is
the sphere. He is the universe.
Headphone listening directs the listener toward a new integrity with himself. But only when he releases the experience by pronouncing the sacred
Om
or singing the Hallelujah Chorus or even the “Star Spangled Banner” does he take his place again with humanity.
PART THREE

Analysis
EIGHT
Notation
Sound Images
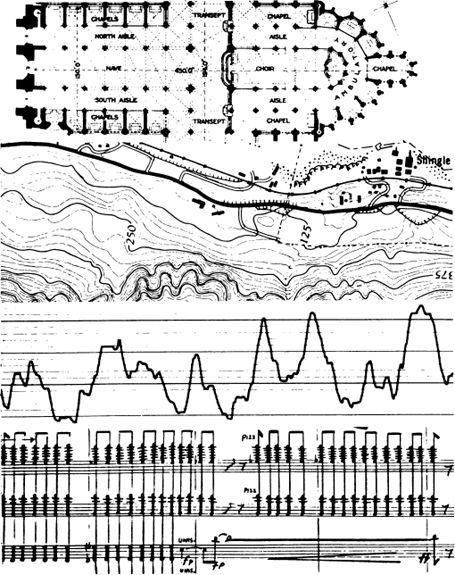
Notation is an attempt to render aural facts by visual signs. The value of notation for both the preservation and analysis of sound is therefore considerable, and it will be useful to spend a few pages discussing notational systems available to the modern researcher before letting our imaginations break forward again with the soundscape theme.
We have two descriptive techniques at our disposal already: we can talk about sounds or we can draw them. The first part of this book has been largely given over to talking about sounds because for a long time this was the principal means by which men attempted to study them, compare and classify them. Sounds resisted graphic representation for a long time and while we take it for granted that sounds may be described visually, the convention is recent, is by no means universal and, as I will show, is in many ways dangerous and inappropriate.
We have three graphic notational systems available:
- that of acoustics, by which the mechanical properties of sounds may be exactly described on paper or a cathode-ray screen;
- that of phonetics, by which human speech may be projected and analyzed;
- musical notation, which permits the representation of certain sounds possessing “musical” features.
It is important to realize that the first two of these systems are descriptive—they describe sounds that have already occurred—while musical notation is generally prescriptive—it gives a recipe for sounds to be made.
The first attempt to give sounds graphic representation was the phonetic alphabet. Pictographs or hieroglyphs draw things or events, but phonetic speech draws the sounds of spoken words—that is the difference, and it represents not only a great advance in the versatility of writing but a radical departure in shifting the focus from the external world to the lips of the speaker.
Musical notation was the first systematic attempt to fix sounds other than those of speech, and its development took place gradually over a long period from the Middle Ages to the nineteenth century. From writing, music borrowed the convention of indicating time by movement from left to right. It introduced a new dimension, the vertical, by which frequency or pitch was indicated, high sounds being up and low sounds down. The matter is largely arbitrary, for while it is customary to point out that there are solid cosmological reasons for such a convention in that shrill sounds like those of birds come from the air while deep sounds come from the earth, thunder does not speak with a soprano voice, the mouse is not a baritone or the rattlesnake a timpanist.
The theoretical vocabulary of music has borrowed many indications from the visual arts and the world of spatial appearances:
high, low, ascending, descending
(all referring to pitch);
horizontal, position, interval
and
inversion
(referring to melody);
vertical, open, closed, thick
and
thin
(referring to harmony); and
contrary
and
oblique
(referring to
counterpoint—
which is itself a visual term). Musical dynamics also preserve traces of their visual origin—for instance, spreading lines indicate
crescendo
, or growing louder, while converging lines indicate the opposite,
diminuendo
. In “The Graphics of Musical Thought”
(Sound Sculpture
, Vancouver, 1975) I discussed how the habit of writing music down on paper made possible numerous devices and forms in Western music which were taken over from the visual arts and architecture.
The dilemma of conventional musical notation today lies in the fact that it is no longer adequate to cope with the meshing of the worlds of musical expression and the acoustic environment, which I have already identified as probably the most significant music-fact of our century, or at least one which must be grasped by the acoustic designer of future soundscapes.
The descriptive notations of acoustics and phonetics are much more recent in development and may really be said to have originated in the twentieth century. For sounds to be given exact physical description in space, a technology had to be worked out by which basic parameters could be recognized and measured in exact, quantitative scales. These parameters were time, frequency and amplitude or intensity. The fact that these three parameters have been identified as in some sense basic should not lead us to believe that this is the
only conceivable
method by which a total description of the behavior of sound is possible. It is also an artificial convention and, like musical notation, suggests a disposition toward 3-D thinking. At any event the three chosen parameters should never be regarded as isolable or independent functions. At least as far as our perception of them is concerned, they are in constant interaction. For instance, intensity can influence time perceptions (a loud note will sound longer than a soft one), frequency will affect intensity perceptions (a high note will sound louder than a low one of the same strength) and time will affect intensity (a note of the same strength will appear to grow weaker over time)—to give just a few examples of interaction. In introducing students to the properties of sound I have noticed frequent confusion between notions as elementary as frequency and intensity and have come to the conclusion that the standard acoustic diagram is not only ambiguous but for some people, at least, may not correspond at all with the natural instincts of aural perception. The problems between acoustics and psychoacoustics may never be clarified as long as the 3-D acoustic image continues to be regarded as an inviolably accurate model of a sound event.
j
Problems of the 3-D Acoustic Image
Machines listen differently than men do. They have exceptionally wide hearing range, fine sensitivity, and no listening preferences whatsoever. They inform us about their listening abilities on paper printouts or cathode-ray displays. Various projections are possible, but with most only two dimensions of sound are given at one time. Thus intensity (or amplitude) is plotted against time, frequency against amplitude, or time against frequency.
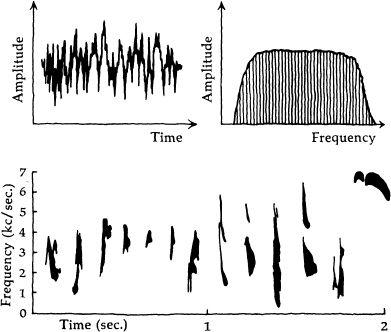
The first two diagrams are for a typical broad-band noise, such as traffic; the third shows the relatively clear melodic pattern of bird-song. A real problem in these graphic projections is that only two dimensions of sound are presented simultaneously. The information is thus incomplete. While theoretically it ought to be possible to plot N + 1 dimensions in an N-dimensional space, in practice the placement of the three dimensions of sound on the two-dimensional space of paper results in formidable reading problems.
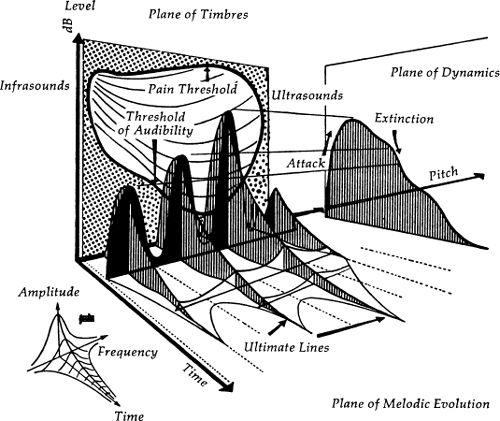
A three-dimensional representation of a simple sound object
.
The sound spectrograph, an instrument developed at the Bell Telephone Laboratories in Princeton, New Jersey, incorporates all three dimensions of a sound, with intensity indicated by shading. Sound spectrograms thus render the sound image complete. The sound represented in the illustration is a Canadian Pacific train whistle and each shade of the contour spectrogram represents a five-decibel variation. But the relatively brief duration possible on the present-day spectrograph (a few seconds) renders it best fitted to represent single sound objects such as isolated bird calls, or juncture points such as the phonemic fluctuations of speech. Furthermore, for easier reading, particularly strong formants or harmonic bands are often inked in, reducing the image again to a two-dimensional projection. (Such is the case in the preceding illustration representing bird-song.)