125 Physics Projects for the Evil Genius (70 page)
Read 125 Physics Projects for the Evil Genius Online
Authors: Jerry Silver

So how small is a photon? Let’s take a 60W light. This means that at about 5 percent efficiency, there are about 3 Joules of energy coming from the bulb every second. According to Planck’s constant this means that every second 3J/6.63 × 10
−34
J-s = 4.5 × 10
33
photons are coming from the light bulb. This incredibly large number of photons gives an idea of the extremely small size of the photon.
The turn-on voltage for an LED gives an indication of how much energy is contained in a single photon. Photons with higher frequency (shorter wavelength) have more energy than photons with lower frequency.
How is a hydrogen atom like the New Jersey Turnpike? Seeing the energy levels of the Bohr atom
.
In this experiment, you look at the colors of the light that the atoms of a particular element give off when excited by electricity. This is the same type of data that led some of the greatest scientific minds of the twentieth century to develop the concept of the atom. The patterns of those colors give us insight into the mysteries of the structure of the atom. Like the New Jersey Turnpike, the electrons in the various energy levels of the hydrogen atom can exit only in certain specific ways.
- diffraction grating
- tube of hydrogen
- high-voltage power supply to excite the hydrogen
- Insert the hydrogen tube into the high-voltage power supply. Make sure the good electrical contact is established between the electrodes of the hydrogen tube and the power supply.
- CAUTION: Do
not
touch the electrical contacts of the high-voltage power supply once it is activated.
Follow all manufacturer’s instructions for safe use of this equipment
. - Darken the room.
- Turn on the power supply and observe a violet-blue glow in the tube.
- Hold a diffraction grating with the scribed lines parallel to the tube in front of your eyes, as indicated in
Figure 120-1
. - Observe the image of the glowing hydrogen tube broken down by the diffraction grating. If you have a spectrometer, observe the light from the hydrogen tube and identify the positions of each of the lines you see. Look for the transmitted light to the left and right of the central image from which the glowing hydrogen tube is located. You may need to use your peripheral vision to see the entire effect.
The light transmitted through the diffraction grating is
not
a continuous rainbow.
The light is broken down into a few bright vertical lines.
The details of the lines you see are summarized in
Table 120-1
.
On the New Jersey Turnpike, if you get on at Exit 6 and go to Exit 7, you pay a $0.80 toll. If you go from Exit 6 to Exit 8, you pay $1.20. In a hydrogen atom, if an electron goes from the third energy level to the second energy level, only red photons (with a wavelength of 656.3 nanometers) are released. But, if an electron goes from the fourth energy level to the second energy level, only blue-green photons (with a wavelength of 486.1 nm) are emitted.
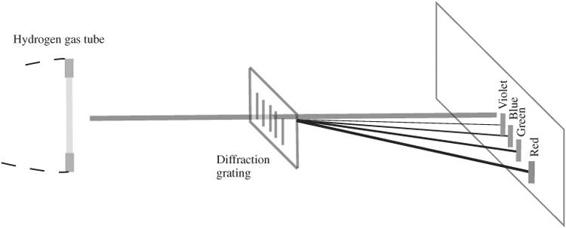
Figure 120-1
Measuring the spectrum of the hydrogen atom
.
On the New Jersey Turnpike, nothing is between Exit 6 and 7, and you never have to pay a toll between $1.20 and 0.80. The hydrogen atom does not produce a photon whose color is between red and blue-green.
Einstein’s interpretation of the photoelectric effect leads us to the conclusion that photons have a certain specific energy based on their frequency. Niels Bohr developed a model of the hydrogen atom based on the idea that the electrons are found in certain specific energy levels, but not in between. A particular change in energy levels results in a photon of a particular color.
When viewed through a diffraction grating, the light from the excited hydrogen atoms does not result in a full rainbow. It, instead, produces only specific brightly colored lines, corresponding to specific wavelengths. Each wavelength is associated with a change from one energy level to another. The bigger the jump, the shorter the wavelength.
The spectral breakdown of light emitted by a hydrogen atom can also be detected using a high-sensitivity light sensor, such as PASCO part number PS-2176. The result for this is shown in
Figure 120-2
.
Table 120-1
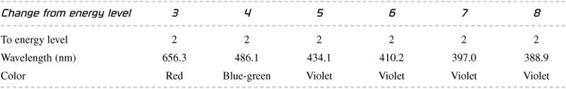
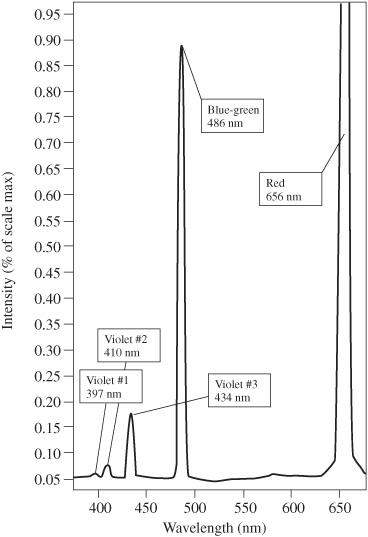
Figure 120-2
Hydrogen emission spectrum. Courtesy PASCO
.
Observation of separate colors from glowing hydrogen gas confirms the model of the atom developed by Niels Bohr, in which electrons occupy specific energy levels. Because electrons cannot be between the established energy levels, many colors (or photon frequencies) are not produced.
Photoelectric effect
.
In 1905, during his “miracle year,” Albert Einstein published five papers. These included special relativity, which dealt with space and time, as well as general relativity, which related mass and energy through the equation E = mc
2
. However, Einstein won his only Nobel Prize for work he did that same year on the
photoelectric effect
.
At the time, it was known that light shining on certain materials could knock out electrons to produce a current. It stood to reason that the stronger the light, the greater the current. Researchers also found that how much of a kick the electrons got (or how much kinetic energy they had) depended on the color of the light. Many scientists expected a stronger light would also release an electron with greater energy. It took Einstein’s brilliance to understand why the color (or frequency) of the light played such a key role in determining how much energy the electrons came away with. The consequences of this insight, along with the contributions of many other scientists, lead to the development of quantum mechanics, which is the basis for the modern electronic world.

Figure 121-1
Albert Einstein explained the photoelectric by claiming that light had a particle-like nature
.
This project introduces you to the idea of the photoelectric effect and guides you to recreate the type of data Einstein interpreted.
- piece of zinc metal
- sandpaper or steel wool
- short jumper wire
- source of ultraviolet light (a carbon arc lamp or possibly a strong “black light”)
- source of visible light (incandescent lamp)
- plate of glass
- electroscope, either purchased or built as a project
- photoelectric effect apparatus, such as the Daedelon EP-05 (available from
www.daedelon.com
) - variable DC voltage source
- voltmeter or multimeter configured as a voltmeter
- various light sources of known frequency: this includes laser pointers of known wavelength, incandescent, carbon arc, or ultraviolet lights
- color filters with known wavelength of transmitted light
This part introduces the basic idea of the photoelectric effect and brings you to the dilemma Einstein addressed.
- Rub the piece of zinc with a piece of sandpaper or steel wool. This removes oxides to expose the metal.
- Discharge the electroscope by touching your finger to the electrode.
- Using a very short jumper, attach the zinc to the electroscope.
- Darken the room.
- Shine the light from an ultraviolet source onto the zinc.
- Observe the effect on the electroscope leaves.
- Discharge the electroscope and compare the effect of the ultraviolet source and the visible source. Also compare the effect of shining the ultraviolet source through a pane of glass that transmits mostly visible range light, but hardly any ultraviolet light.
- Charge the electroscope positively and observe the effect of shining ultraviolet light on the zinc.
- Charge the electroscope negatively and observe the effect of shining the ultraviolet light on the zinc.
This approach uses a metal target in a vacuum tube. Because the currents that need to be measured are so small, it is helpful to have the detector very close to the source of the current. This procedure goes through the generic steps to make this measurement with specific references to the EP-05 operation (more detailed instructions are available with that apparatus):
1. Set up the fluorescent lamp to focus on the detector (photodiode).
2. Attach a voltmeter to read the stopping voltage (stopping potential) across the photodiode. (The connections are the red and black banana jacks on the EP-05.)
3. Place the blue filter over the opening going into the photodiode. The apparatus should be set up as shown in
Figure 121-2
.
4. Darken the room. If necessary, construct a light shield from a cardboard box to protect the photodiode from stray light.
5. Adjust the stopping potential, so all the electrons are turned back and there is no photocurrent. (This is accomplished by turning the “voltage knob” to the full clockwise position.)
6. Now, adjust the stopping potential to its minimum value. (This can be done by turning the voltage knob as far in the counterclockwise position as possible.)