125 Physics Projects for the Evil Genius (69 page)
Read 125 Physics Projects for the Evil Genius Online
Authors: Jerry Silver

The magnetic field of the Earth can be measured by balancing it with a known magnetic field. If that magnetic field is at right angles to the horizontal component of the Earth’s magnetic field, the compass will point in a new direction that is 45 degrees from the original position. Away from the equator, the Earth’s magnetic field is at an angle to the horizontal, which can be measured. The overall magnetic field will be slightly higher than the horizontal component.
Weighing the Earth
.
Shortly after Sputnik was launched by the former USSR, President Dwight David Eisenhower, asked his generals to tell him,
based on its orbit
, how massive the satellite was. Unfortunately, they were unable to provide the U.S. president with the information he requested. However, they would have been able, instead, to tell him the mass of the Earth (which Eisenhower
wasn’t
concerned about). In this project, you use a different satellite—the moon—to determine the mass of the Earth. You also explore how the scientist Cavendish performed some painstaking calculations of gravitational attraction and was able to accomplish the same thing.
- moon
- calendar
- Determine how long it takes for the moon to circle the Earth.
- A calendar can give a reasonable result. A more accurate value is the sidereal period, which indicates only the time it takes for the moon to circle the Earth, without consideration for how long it takes to return to a particular phase. This can be obtained from a sidereal table or by subtracting 2.2 days from the value obtained by observing the number of days from one full moon to another.
- Calculate the velocity of the moon in its orbit based on its average radius,
r
, of 384,400 kilometers (3.844 × 10
8
m). You can do this using the equation:

- Calculate the mass of the Earth using the equation

where
G
is the constant of Universal Gravitation = 6.67 × 10
−11
m
3
/kgs
2
Using the following values:
T = 27.322 days = 2,360,621 seconds
v = 2πr/T = 1,023 meters/second
r = 3.844 × 10
8
m
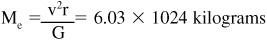
This is within 1 percent of the accepted value for the mass of the Earth of 5.97 × 10
24
kilograms.
Newton’s law of universal gravitation states there is an attractive force between any two masses in the universe. The attractive force is related to how massive the objects are and how far apart they are
from each other. The gravitational force is linked to the mass and distance by a constant, “big G,” called the
universal gravitation constant
. Since the gravitational force is the force that provides the centripetal force that keeps a satellite in orbit, we can solve for the mass of the Earth if we know the other variables in the equation. Similarly, knowing that the gravitational force equals the weight of an object, we can solve for the mass of the Earth.
Cavendish’s famous experiment is one of our “wish-list” experiments that can be used to determine the big G and, as a result, the mass of the Earth. Gravitational force between two masses can be measured using an apparatus shown in
Figures 118-1
and
118-2
. The relatively small force is detected by measuring the torsion it produces in a thin filament between the masses.
The mass of a body that a satellite rotates around can be determined by the orbital period of that satellite. A key component of the force is the universal gravitational constant,
G
. By knowing
G
, it is possible to determine the mass of the Earth, using either the weight of objects on the Earth’s surface or the orbital period of satellites circling around the Earth.
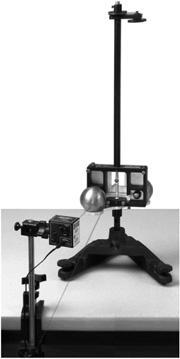
Figure 118-1
Cavendish apparatus
.

Figure 118-2
Top view of masses in the Cavendish apparatus
.
The Twentieth Century
What is the size of a photon
?
One of the pivotal discoveries of the twentieth century was the recognition that light is made of
photons
, which can be thought of as minute particles of light. Light behaves in many ways like a wave, but it also behaves in many ways as if it consisted of particles. Just how big (or small) are these particles of light?
- several LEDs (light-emitting diodes) of known wavelength
- variable power supply
- jumper wires
- voltmeter (or multimeter configured as a multimeter)
- dark room
- Attach the positive end of the voltmeter to the positive end of the power supply, and the negative end of the voltmeter to the negative end of the power supply.
- Adjust the power supply to give a reading of zero volts.
- Select an LED. Use jumper wires to connect the positive side of the power supply to the positive terminal of the LED. (The positive terminal of the LED is the longer one.)
- Connect the negative side of the power supply to the LED.
- Darken the room.
- Slowly increase the voltage from the power supply until the LED just begins to give off light. For visible light, this will be between 1.2 volts and 2.5 volts.
- Write down the voltage that results in light just being produced.
- Repeat this process for all the LEDs you have.
- Make a graph of voltage versus frequency.
The schematic for this experiment is shown in
Figure 119-1
.
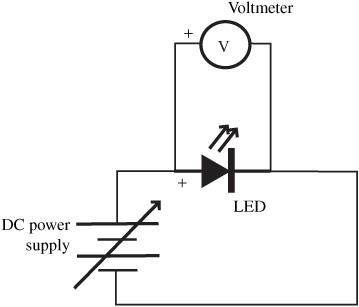
Figure 119-1
Circuit to measure LED turn-on voltage
.
The higher the frequency, the higher the voltage needed to turn on the LED. The relationship is linear, as shown in
Figure 119-2
.
According to quantum theory, the energy of a photon depends on its frequency. Higher frequency light (or light closer to the blue side of the visible spectrum) has more energy. Lower frequency light (closer to the red side) has less energy. For a photon of a given frequency,
f
, or color, the energy is given by hf, where
h
is called
Planck’s constant
.

Figure 119-2
LED voltage versus frequency
.
The amount of energy needed to turn on an LED is given by qV, where
q
is the charge of an electron = 1.6 × 10
−19
C and V is the applied voltage. From the slope of the graph, you can estimate Planck’s constant (from the slope of the previously plotted equation, v = (h/q)f). Planck’s constant can be determined by dividing the slope of the graph by the charge of an electron. The accepted value for Planck’s constant is 6.63 × 10
−34
J-s. The slope of the graph in
Figure 119-2
is about 7 × 10
−34
J-s, which provides a reasonable order of magnitude estimate of Planck’s constant.