The Numbers Behind NUMB3RS (19 page)
Read The Numbers Behind NUMB3RS Online
Authors: Keith Devlin

Figure 7. Fourier analysis of a wave (such as the sound wave shown above) represents it as an infinite sum of sine waves (such as the one shown below) of different frequencies and amplitudes.
Part of the complexity of Fourier analysis, and the reason it usually takes infinitely many sine and cosine terms to generate a given function, is that the sine and cosine functions continue forever, undulating in a regular wave fashion. In the 1980s, a few mathematicians began to play with the idea of carrying out Fourier's analysis using finite pieces of a wave, a so-called wavelet. (See figure 8.) The function that generates such a wavelet is more complicated than the sine and cosine functions, but the extra complexity of the function is more than compensated by the great increase in simplicity of the resulting representation of a given function. The idea is to start with a single “mother wavelet,” and create daughters by translating (shifting) the mother by one unit or else expanding or contracting it by a power of 2. You then express your given function as a sum of daughter wavelets generated by the single mother.
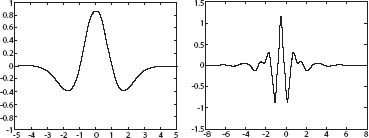
Figure 8. Wavelets. The one on the left is called, for obvious reasons, the “Mexican hat.”
Wavelet theory really took off in 1987, when Ingrid Daubechies, of AT&T Bell Laboratories, constructed a family of wavelets that made this process particularly efficient when the calculations were carried out on a computer. It was not long after Daubechies' advance that the FBI started to look seriously at using wavelets to encode fingerprints. Instead of coding the bits that make up a digitized fingerprint image, the FBI's computer encodes the key numerical parameters (coefficients) in the wavelet representation of the image function. When a law enforcement agent asks for a particular set of fingerprints to be displayed on a computer screen or printed out, the computer actually
re-creates
the image using the coefficients stored in the file.
With fingerprints encoded as sequences of numbers, it becomes a relatively easy task to carry out automated computer searches looking for a match of a fingerprint in the database with one obtained from, say, a crime scene. The computer searches for strings of numbers that are very close to the string of numbers that comes from the sample. (You have to adopt a mathematically sophisticated approach to decide what “very close” amounts to in this situation; apart from that, it's a straightforward process.)
One fascinating property of wavelet encoding is that it automatically picks out the same features of an image that our eyes do. The wavelet coefficients in the final representation correspond to pixels that are very different from their neighbors, typically at the edge of the objects in the image. This means that wavelets re-create an image mostly by drawing edgesâwhich is exactly what we do when we draw a sketch. Some researchers have suggested that the analogy between wavelet transforms and human vision is no accident, and that our neurons filter visual signals in a manner similar to wavelets.
10
Connecting the Dots
The Math of Networks
PROTEST
A homemade bomb explodes beneath a car parked outside a U.S. Army recruitment office in downtown Los Angeles, killing a nearby pedestrian and injuring his wife. The bombing has all the earmarks of an antiâVietnam War bombing carried out thirty-five years earlier to the day, even down to the message sent to the FBI (this time by e-mail) claiming responsibility and promising further attacks, the only change in the wording being the substitution of “Iraq” for “Vietnam”.
The FBI had always believed the 1971 bombing was the work of an antiwar protester named Matt Stirling, who had fled immediately after the bombing and had never been apprehended. Don's first thought is that Stirling has returned to carry out some sort of anniversary repeat, and he retrieves all the files from the earlier case.
Still, it could be a copycat bombing carried out by some other person or group. But if it was, the new perpetrators would have to have had access to some detailed information about the previous event, so maybe the old case could provide clues to who organized the new one. Either way, Don has to find out all he can about the 1971 bombing. Charlie looks on as his brother works through the mountain of information.

This is how viewers of the second-season episode of
NUMB3RS
called “Protest,” broadcast on March 3, 2006, were introduced to social network analysis, a relatively new branch of mathematics that became hugely important in the wake of 9/11.
A NEW KIND OF WAR, A NEW KIND OF MATH
The events of 9/11 instantly altered American perceptions of the words “terrorist” and “network”, and the United States and other countries rapidly started to gear up to fight a new kind of war against a new kind of enemy. In conventional warfare, conducted in specific locations, it was important to understand the terrain in which the battles will be fought. In the war against terror, there is no specific location. As 9/11 showed only too well, the battleground can be anywhere. The terrorists' power base is not geographic; rather, they operate in networks, with members distributed across the globe. To fight such an enemy, you need to understand the new “terrain”: networksâhow they are constructed and how they operate.
The mathematical study of networks, known as network theory or network analysis, is based on a branch of pure mathematics called graph theory, which studies the connections between points in a set. In using techniques of graph theory and network analysis to analyze social networks, such as terrorist networks, mathematicians have developed a specialized subdiscipline known as social network analysis (SNA). SNA saw rapid development in the years leading up to 9/11 and has been an even hotter topic since. The applicability of SNA to fight crime and terrorism had been known to specialists for many years, but it was only after the Al Qaeda 9/11 plot became known that the general public realized the critical importance of “connecting the dots” in investigations and surveillance of terrorists.
THE 9/11 ATTACKS AS A CASE STUDY
The basic facts are now well known: On the morning of September 11, 2001, four commercial airliners were hijacked and turned into weapons by Al Qaeda terrorists. Two of them were crashed into the World Trade Center in New York, one into the west wing of the Pentagon in Washington, D.C., and another, believed to be heading for the White House, was heroically diverted by passengers, who perished along with the terrorists when the plane crashed in a field seventy-five miles from Pittsburgh, Pennsylvania.
The nineteen terrorists who boarded the planes that day were carrying out a plot orchestrated by Pakistan-born Khalid Sheik Mohammed, who was captured in 2003. The formal inquiry later conducted by the panel known as the 9/11 Commission outlined the information and warnings that American intelligence agencies had prior to the attacks. The Department of Homeland Security has vowed that all of the intelligence agencies would henceforth share the information needed for analysts to “connect the dots” and prevent future terrorist attack plans from succeeding.
How do mathematicians contribute to this effort? And what sort of methods do they use to analyze terrorist networks?
It is difficult to do justice to the range and power of the mathematical methods used by intelligence agencies in what has become known as the War on Terror. In fact, it's not just difficult to describe all the techniques used, it is illegalâsome of the best work done by mathematicians on these problems is highly classified.
The National Security Agency, for instance, known to be the largest single employer of research-level mathematicians in the world, and affiliated organizations such as the Centers for Communications Research (CRC), employ some of the most powerful and creative mathematical problem-solvers in the world. These mathematicians develop highly specialized methods and use them to solve real-world problems in cryptology, speech and signal processing, and counterterrorism. The NSA and similar organizations also maintain an extensive network of their ownâa network of mathematicians from universities (including both authors of this book) who work with them from time to time to help develop new methods and solve hard problems. (In an early episode of
NUMB3RS
, FBI agent Don Eppes is surprised to learn that his younger brother Charlie has consulted for the NSA and has a security clearance at a higher level than Don's.)
Perhaps the best way (and the safest for your two authors) to provide a glimpse of some of the methods used is to look at studies that have been done by experts outside of the intelligence networks, using publicly available information. One of the most interesting public analyses of the 9/11 terrorists was published in April 2002 in the online journal
first Monday
. The article “Uncloaking Terrorist Networks” was written by Valdis E. Krebs, a mathematically trained management consultant with extensive experience in applying social network analysis to help clients like IBM, Boeing, and Price Waterhouse Coopers understand the way information flows and relationships operate in complex human systems. Krebs used some standard SNA calculations to analyze the structure of parts of the Al Qaeda network that (publicly available documents showed) were involved in the 9/11 attack. figure 9 shows a graph of relationships among some of the key individuals, considered by Krebs and a later analysis published on his website (orgnet.com). The links indicate direct connections between terrorists suspected in early investigations, beginning in January 2000, when the CIA was informed that two Al Qaeda operatives, Nawaf Alhazmi and Khalid Almihdhar (shown in one of the boxes) had been photographed attending a meeting of known terrorists in Malaysia, after which they returned to Los Angeles, where they had been living since 1999. The other box contains Fahad al Quso, whose connection to Almihdhar was established when both attended the Malaysia meeting. Al Quso and Walid Ba' Attash appeared later in 2000 on the list of suspects in the October 12 bombing of the USS
Cole
while the destroyer was sitting in the Yemeni port of Aden, an attack that killed seventeen sailors. Included in the network shown in figure 9 are eleven of the nineteen September 11 terrorists, all of whom have either a direct link to Almihdhar and Alhazmi, the original suspects, or else are indirectly connected at a distance once removed.
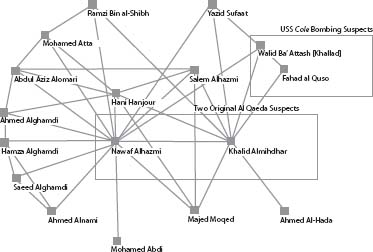
Figure 9. Graph of the Al Qaeda group behind the September 11 attacks.
Of course, this network graph was drawn “after the fact” of the 9/11 attacks and the subsequent investigations. The key challenge for investigatorsâand therefore for mathematiciansâis to extract information in advance, typically from much larger pictures, including hundreds or even thousands of individuals. Such large networks are likely to give rise to many false leads. Normally they will also suffer from the highly troublesome phenomenon of missing dataâfor example, names of important participants who are absent from the graph because their existence is not known or who are present but whose links to others in the graph are not known.
A particularly important challenge is to identify in a large network those individuals who play key rolesâas leaders, as facilitators, as communications “go-betweens,” and so on. The mathematical tools of graph theory and social network analysis can be applied to identify such individuals. For example, in analyzing a larger network graph in his 2002 paper, Krebs performed calculations of three standard “scores” designed to point out who are the most important people in a network. The top five individuals for each of these scores were as follows.

At the top of the list for all three calculated scores is Mohamed Atta, whose role as the ringleader of the 9/11 plot was acknowledged by Osama bin Laden in a notorious videotape released soon after the attacks. Others, such as Alhazmi, one of the two original suspects, and Hanjour and Al-Shehhi, were among the nineteen who boarded the planes on 9/11 and died that day. Others were not aboard the planes but played key roles: Moussaoui, later convicted as the “twentieth hijacker,” Bin al-Shibh, Atta's roommate in Germany who couldn't gain entry to the United States, and Ben Khemais, the head of Al Qaeda's European logistical network, later convicted in Milan on conspiracy charges in another plot.
The fact that these key individuals were singled out from a network graph much larger than the one shown above, using standard social network analysis calculations, illustrates the usefulness of such calculations, which are currently being performed thousands of times a day by computer systems set up to help analysts monitor terrorist networks.
BASIC GRAPH THEORY AND “MEASURES OF CENTRALITY”
To understand the calculations used to single out the key individuals in a network graph, we need to assemble a few basic ideas. first of all, the mathematical concept of a graph as used in the present discussion is not the same as the more common notion of “graphing a curve” with vertical and horizontal axes. Rather, it refers to a set of points called nodesâpeople, for exampleâwith some pairs of nodes connected by an edge and other pairs of nodes not connected. These so-called simple graphs, with no multiple edges allowed between the same two nodes, are used to represent the existence of some relationship, such as “works with” or “has a bond with” or “is known to have communicated with”. Whenever two nodes do not have an edge connecting them, it means that a relationship does not existâor is not known to exist.
Pictures of graphs are helpful, but the same graph can be represented by many different pictures, since the location of the nodes in a picture is chosen entirely as a matter of convenience (or to make things look nice). Mathematically, a graph is not a picture; it is an abstract set of nodes (also called vertices), together with edges connecting certain pairs of nodes.
A basic notion of graph theory that turns out to be important in social network analysis is the degree of a nodeâthat is, the number of other nodes directly connected to it by edges. In a graph describing a human network, nodes of high degree represent “well-connected” people, often leaders. (Note that the word “degree” here has a different meaning from the one associated with the phrase “six degrees of separation,” which is discussed later in this chapter.)