The Numbers Behind NUMB3RS (22 page)
Read The Numbers Behind NUMB3RS Online
Authors: Keith Devlin

Gaining confidence, he writes on the board the numbers that describe their individual circumstances, saying, “Now I'll need to assign some variables, based on things like your respective ages, criminal records, loved ones on the outside⦔
Over the heated objections of the ringleader, whom Charlie has labeled “G” on the blackboard, the lecture comes to a conclusion.
“Okay, there it is. Fitchman, you have a risk assessment of 14.9. âW', you have 26.4, and âG', you have a risk assessment of, oh, 7.9.”
Fitchman asks, “What does that mean?” and Don replies, “It means that Ben here [âW' on the board] has the most to lose by going to prison.”
Don and Charlie elaborate, talking about Ben's youth, his lack of a criminal record, his close family ties, and so on, leading to Charlie's summary of his risk assessment for the young man: “Therefore, as I've shown mathematically, you have the most to lose if you don't cooperate.”
What follows is undoubtedly the first “math-induced copping of a plea” in the history of television! Far-fetched? Perhaps. But Charlie's math was spot on.
REAL-WORLD RISK ASSESSMENT VERSUS TERRORISM
These days, many mathematical tools are brought to bear on the problem of combating terrorismâdata mining, signal processing, analysis of fingerprints and voiceprints, probability and statistics, and more. Since the strategies of both terrorists and defenders involve considerations of what the other side will do, the application of game theory is an attractive option, much as it was throughout the cold war. But as we saw in the case of the prisoner's dilemma and the fictional “Dirty Bomb” episode on
NUMB3RS
, there are limitations to game theory as a means of determining the best courses of action. The use of side communications and the formation of agreements among players, the uncertainties about which strategies they are actually usingâwhat game theorists call “incomplete information”âand the difficulty of determining realistic payoffs as judged by the players, all combine to make the challenges facing game theorists extremely difficult.
Risk assessment is a key ingredient in mathematicians' efforts to supplement or even replace game-theoretic analyses. A good example is given in the recent (2002) paper “Combining Game Theory and Risk Analysis in Counterterrorism: A Smallpox Example”
*
by David L. Banks and Steven Anderson.
Their analysis of the threat of a smallpox attack by terrorists uses the scenarios that many government experts and other researchers have focused upon. These comprise three categories of possible attacks:
- no smallpox attack
- a lone terrorist attack on a small area (like the infamous post-9/11 anthrax letters in the United States)
- a coordinated terrorist attack on more than one city
and four scenarios for defense:
- stockpile smallpox vaccine
- stockpile vaccine and develop biosurveillance capabilities
- stockpile vaccine, develop biosurveillance, and inoculate key personnel
- vaccinate everyone in advance (except the “immunocompromised”)
Banks and Anderson consider the game-theoretic payoff matrix for the three attack strategies versus four defense strategies as essentially twelve boxes to be filled in, each one containing the dollar cost (or equivalent) to the defender. To determine the numerical values to put in those boxes, they propose using a separate risk assessment for each box. For example, the combination of strategies (“no smallpox attack”, “stockpile vaccine”) incurs a cost that the authors describe (as of the June 2002 government decision-making) as
Â
ET
Dry
+ ET
Avent
+ ET
Acamb
+ VIG + PHIS,
Â
where
Â
ET
Dry
, ET
Avent
= costs of efficacy and safety tests for the Dryvax and Aventis vaccines,
ET
Acamb
= cost of new vaccine production and testing from Acambis,
VIG = cost of sufficient doses of Vaccinia Immune Globulin to test adverse reactions,
PHIS = cost of setting up the public health infrastructure to manage the stockpiling.
At the time of the authors' analysis, a government contract fixed the Acambis cost at $512 million, but the costs for testing Dryvax and Aventis vaccines involve clinical trials and possible follow-ups. Moreover, there is great uncertainty about the cost of production and testing of sufficient doses of VIG and about the costs of the PHIS, the public health infrastructure. The key to the authors' mathematical analysis is to derive estimates of these uncertain dollar amounts from expert opinions. Rather than use a single best guess of each amount, they propose using ranges of plausible values, expressed by probability distributions. For example, they model the public health infrastructure's cost as the familiar bell-shaped curve, centered at $940 million, with a spread (a standard deviation) of $100 million.
Once the risk assessments for the twelve possible combinations of attack/defense strategies are made, Banks and Anderson see how the game plays out by sampling possible payoff matricesâwith definite numbers filled inâusing the probability distributions that describe the experts' opinions. It is essentially like drawing out of a hat possible answers to all of the unanswered questions, generating different payoff matrices one after another, each of which could be true. For each payoff matrix, they calculate a performance score for each of the four defense strategies. These scores describe the cost incurred by each defense strategy when the attacker uses their best possible strategy (a maximin strategy, in game-theory lingo).
Using the best expert opinions available in 2002, Banks and Anderson found in their computer simulations that the most effective strategy for defense was the “vaccinate everyone” strategy. But they caution that their results are not conclusive, since all four defense strategies scored in comparable ranges, indicating that the uncertainty in the public debates on U.S. strategy is not unreasonable. In recommending that their mathematical methods should be applied to future analyses of terrorist threats and defensive strategy, Banks and Anderson argue that using game theory and risk assessment methods
together
is better than using either approach alone. That is because risk assessment by itself fails to capture the kind of interaction between adversaries (“If he does this, I can do that”) that game theory incorporates naturally, whereas game theory ordinarily requires definite payoffs rather than the probabilistic analysis of payoffs that risk assessment accommodates.
OPERATIONS RESEARCH VERSUS NUCLEAR WEAPONS IN SHIPPING CONTAINERS
Among the terrorist threats that were heavily debated during the 2004 presidential election campaigns was the possibility of smuggling of nuclear materials and weapons into the United States through seaports. It is widely believed that a system of defense against this threat should include inspections of shipping containers at overseas ports before they are loaded onto ships bound for the United States. At the world's second-busiest port, in Hong Kong, a demonstration project for such inspections was set up by the Hong Kong Container Terminal Operators Association. Inspections there are conducted as follows.
- Trucks carrying a shipping container on its way to be unloaded onto a ship must be permitted to pass through a gate.
- Seventy-five meters in front of the gate, the trucks must pass through a portal and be scanned by a radiation portal monitor(RPM) that detects neutron emissions.
- If the RPM cannot determine that the container contents pose no risk, the container can be diverted to a customs inspection facility for a different type of scan and possible physical inspection of its contents.
The Hong Kong pilot program was designed so that the trucks would pass the portal with the RPM detector at a speed of ten miles per hour, permitting a scan time of approximately three seconds. Longer scan times would permit detection of lower rates of neutron emissions, but slowing down the progress of the line would incur costs. The inspection protocol has to specify other variables, too, including the targeting of certain containers for closer scrutiny based on the automated targeting system of the U.S. Customs and Border Protection service. This is an expert system that uses the data accompanying each container shipment, its cargo manifest, along with possible intelligence information and observable indicators that suggest a container is more likely to be “dirty.”
The key to the Hong Kong demonstration project is to avoid slowing the flow of trucks into the unloading area. The RPM scans have to be carried out without causing a slowdown, which would significantly increase the cost of port operations. The details of the setup include a branching of the queue after the trucks enter the front gate into four lanes, each with a guard who verifies the drivers' identities and tells them where to go to drop off their containers.
The Hong Kong system was carefully designed to be efficient. But just as Charlie Eppes is rarely satisfied with any system he hasn't had an opportunity to analyze mathematically, a group of real-world operations researchers (see below for an explanation of what that term means) decided to set up a mathematical model of every aspect of the Hong Kong systemâthe RPM scanning of the line of trucks before the front gate, the protocol for analyzing the scans and choosing some for further investigation, and the cost of the whole operation.
In their paper “The Optimal Spatial Deployment of Radiation Portal Monitors Can Improve Nuclear Detection at Overseas Ports” (2005), Lawrence M. Wein, Yifan Liu, Zheng Cao, and Stephen E. Flynn analyze mathematically a set of alternative designs for the nuclear screening of container shipments to determine whether it is possible to improve upon the effectiveness of the Hong Kong project's design. Before explaining their ideas, however, we should answer the question: What is operations research and how could it lead to a better-designed system?
Operations Research (OR) refers to a wide range of mathematical tools and methods that are applied to what is sometimes called “the science of better”âthat is, the analysis of how real-world operations work and how to make them work better. Originally applied during the period after World War II to military systems like logistics, supply, and naval warfare, OR soon found other usesâto increase the efficiency of business operations, public facilities (including airports, amusement parks, and hospitals), public services such as police departments and paramedics, and many government operations and services. The tools in operations research are all mathematicalâfor example, the use of mathematical models for complex systems, algorithms, computer simulations, probability theory, and statistics. Sometimes the term “management science” is used as a rough synonym for operations research.
Applications of OR in police work have included mathematical investigations of how to distribute patrols in high-crime areas, how to guard high-profile targets, and how to organize and analyze data for use in investigations. Many universities have departments of operations research or management science, and faculty members, in addition to teaching, typically do both theoretical research on mathematical methods and consulting on real-world problems.
One of the classical components of OR is queueing theory, a branch of probability theory that investigates the phenomena associated with “waiting in line” (known in the United Kingdom as “queueing,” hence the theory's name), and seeks to provide answers to questions such as “What is the most efficient way to design the waiting lines in a bank?” or “How many tellers will be needed to limit the average waiting time to five minutes if the customers flow in at a rate
r
, and each requires an average of
t
minutes to be serviced?”
Now let us return to the trucks waiting patiently in Hong Kong to unload their containers onto ships. We'll see how operations researchers like Wein, Liu, Cao, and Flynn use mathematical analysis to design better systems and calculate their performance and cost. We start with a picture of the flow of trucks and containers through the front gate:
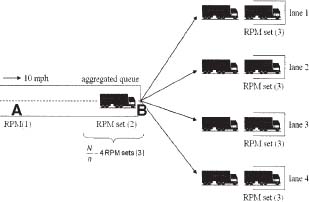
The Hong Kong demonstration experiment places an RPM at point A, 75 meters ahead of point B, the front gate. This ensures that trucks can flow past the monitor at a regulated speed of 10 miles per hour. Since each 40-foot shipping container is carried lengthwise on a truck, it takes about three seconds for it to pass through, so that the monitor collects three seconds worth of neutron emission counts. The number of neutrons counted depends on A, e, S, t, and
r
, where