The Numbers Behind NUMB3RS (3 page)
Read The Numbers Behind NUMB3RS Online
Authors: Keith Devlin

When Rossmo describes how Rigel works to a law enforcement agency interested in the program, he offers his favorite metaphorâthat of determining the location of a rotating lawn sprinkler by analyzing the pattern of the water drops it sprays on the ground. When
NUMB3RS
cocreators Cheryl Heuton and Nick Falacci were working on their pilot episode, they took Rossmo's own metaphor as the way Charlie would hit upon the formula and explain the idea to his brother.
Rossmo had some early successes dealing with serial crime investigations in Canada, but what really made him a household name among law enforcement agencies all over North America was the case of the South Side Rapist in Lafayette, Louisiana.
For more than ten years, an unknown assailant, his face wrapped bandit-style in a scarf, had been stalking women in the town and assaulting them. In 1998 the local police, snowed under by thousands of tips and a corresponding number of suspects, brought Rossmo in to help. Using Rigel, Rossmo analyzed the crime-location data and produced a map much like the one Charlie displayed in
NUMB3RS
, with bands of color indicating the hot zone and its increasingly hot interior rings. The map enabled police to narrow down the hunt to half a square mile and about a dozen suspects. Undercover officers combed the hot zone using the same techniques portrayed in
NUMB3RS
, to obtain DNA samples of all males of the right age range in the area.
Frustration set in when each of the suspects in the hot zone was cleared by DNA evidence. But then they got lucky. The lead investigator, McCullan “Mac” Gallien, received an anonymous tip pointing to a very unlikely suspectâa sheriff's deputy from a nearby department. As just one more tip on top of the mountain he already had, Mac was inclined to just file it, but on a whim he decided to check the deputy's address. Not even close to the hot zone. Still something niggled him, and he dug a little deeper. And then he hit the jackpot. The deputy had previously lived at another addressâright in the hot zone! DNA evidence was collected from a cigarette butt, and it matched that taken from the crime scenes. The deputy was arrested, and Rossmo became an instant celebrity in the crime-fighting world.
Interestingly, when Heuton and Falacci were writing the pilot episode of
NUMB3RS
, based on this real-life case, they could not resist incorporating the same dramatic twist at the end. When Charlie first applies his formula, no DNA matches are found among the suspects in the hot zone, as happened with Rossmo's formula in Lafayette. Charlie's belief in his mathematical analysis is so strong that when Don tells him the search has drawn a blank, he initially refuses to accept this outcome. “You must have missed him,” he says.
Frustrated and upset, Charlie huddles with Don at their father Alan's house, and Alan says, “I know the problem can't be the math, Charlie. It must be something else.” This remark spurs Don to realize that finding the killer's
residence
may be the wrong goal. “If you tried to find me where I
live
, you would probably fail because I'm almost never there,” he notes. “I'm usually at
work.
” Charlie seizes on this notion to pursue a different line of attack, modifying his calculations to look for
two
hot zones, one that might contain the killer's residence and the other his place of work. This time Charlie's math works. Don manages to identify and catch the criminal just before he kills another victim.
These days, Rossmo's company ECRI (Environmental Criminology Research, Inc.) offers the patented computer package Rigel along with training in how to use it effectively to solve crimes. Rossmo himself travels around the world, to Asia, Africa, Europe, and the Middle East, assisting in criminal investigations and giving lectures to police and criminologists. Two years of training, by Rossmo or one of his assistants, is required to learn to adapt the use of the program to the idiosyncrasies of a particular criminal's behavior.
Rigel does not score a big win every time. For example, Rossmo was called in on the notorious Beltway Sniper case when, during a three-week period in October 2002, ten people were killed and three others critically injured by what turned out to be a pair of serial killers operating in and around the Washington, D.C., area. Rossmo concluded that the sniper's base was somewhere in the suburbs to the north of Washington, but it turned out that the two killers did not live in the area and moved too often to be located by geographic profiling.
The fact that Rigel does not always work will not come as a surprise to anyone familiar with what happens when you try to apply mathematics to the messy real world of people. Many people come away from their high school experience with mathematics thinking that there is a right way and a wrong way to use math to solve a problemâin too many cases with the teacher's way being the right one and their own attempts being the wrong one. But this is rarely the case. Mathematics will always give you the correct answer (if you do the math right) when you apply it to very well-defined physical situations, such as calculating how much fuel a jet needs to fly from Los Angeles to New York. (That is, the math will give you the right answer provided you start with accurate data about the total weight of the plane, passengers, and cargo, the prevailing winds, and so forth. Missing a key piece of input data to incorporate into the mathematical equations will almost always result in an inaccurate answer.) But when you apply math to a social problem, such as a crime, things are rarely so clear-cut.
Setting up equations that capture elements of some real-life activity is called constructing a “mathematical model.” In constructing a
physical
model of something, say an aircraft to study in a wind tunnel, the important thing is to get everything right, apart from the size and the materials used. In constructing a mathematical model, the idea is to get the appropriate
behavior
right. For example, to be useful, a mathematical model of the weather should predict rain for days when it rains and predict sunshine on sunny days. Constructing the model in the first place is usually the hard part. “Doing the math” with the modelâi.e., solving the equations that make up the modelâis generally much easier, especially when using computers. Mathematical models of the weather often fail because the weather is simply far too complicated (in everyday language, it's “too unpredictable”) to be captured by mathematics with great accuracy.
As we shall see in later chapters, there is usually no such thing as “one correct way” to use mathematics to solve problems in the real world, particularly problems involving people. To try to meet the challenges that confront Charlie in
NUMB3RS
âlocating criminals, tracing the spread of a disease or of counterfeit money, predicting the target selection of terrorists, and so onâa mathematician cannot merely write down an equation and solve it. There is a considerable art to the process of assembling information and data, selecting mathematical variables that describe a situation, and then modeling it with a set of equations. And once a mathematician has constructed a model, there is still the matter of solving it in some way, by approximations or calculations or computer simulations. Every step in the process requires judgment and creativity. No two mathematicians working independently, however brilliant, are likely to produce identical results, if indeed they can produce useful results at all.
It is not surprising, then, that in the field of geographic profiling, Rossmo has competitors. Dr. Grover M. Godwin of the Justice Center at the University of Alaska, author of the book
Hunting Serial Predators
, has developed a computer package called Predator that uses a branch of mathematical statistics called multivariate analysis to pinpoint a serial killer's home base by analyzing the locations of crimes, where the victims were last seen, and where the bodies were discovered. Ned Levine, a Houston-based urban planner, developed a program called Crimestat for the National Institute of Justice, a research branch of the U.S. Justice Department. It uses something called spatial statistics to analyze serial-crime data, and it can also be applied to help agents understand such things as patterns of auto accidents or disease outbreaks. And David Canter, a professor of psychology at the University of Liverpool in England, and the director of the Centre for Investigative Psychology there, has developed his own computer program, Dragnet, which he has sometimes offered free to researchers. Canter has pointed out that so far no one has performed a head-to-head comparison of the various math/computer systems for locating serial criminals based on applying them in the same cases, and he has claimed in interviews that in the long run, his program and others will prove to be at least as accurate as Rigel.
ROSSMO'S FORMULA
finally, let's take a closer look at the formulas Rossmo scribbled down on that paper napkin on the bullet train in Japan back in 1991.
To understand what it means, imagine a grid of little squares superimposed on the map, each square having two numbers that locate it: what row it's in and what column it's in, “
i
” and “
j
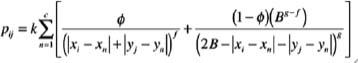
”. The probability, p
ij
, that the killer's residence is in that square is written on the left side of the equation, and the right side shows how to calculate it. The crime locations are represented by map coordinates, (x
1
,y
1
) for the first crime, (x
2
,y
2
) for the second crime, and so on. What the formula says is this:
To get the probability p
ij
for the square in row “
i
”, column “
j
” of the grid, first calculate how far you have to go to get from the center point (x
i
,y
j
) of that square to each crime location (x
n
,y
n
). The little “n” here stands for any one of the crime locationsân=1 means “first crime,” n=2 means “second crime,” and so on. The answer to the question of how far you have to go is:
| x
i
â x
n
| + | y
j
â y
n
|
and this is used in two ways.
Reading from left to right in the formula, the first way is to put that distance in the denominator, with ? in the numerator. The distance is raised to the power
f
. The choice of what number to use for this
f
will be based on what works best when the formula is checked against data on past crime patterns. (If you take
f
= 2, for example, then that part of the formula will resemble the “inverse square law” that describes the force of gravity.) This part of the formula expresses the idea that the probability of crime locations
decreases
as the distance increases, once outside of the buffer zone.
The second way the formula uses the “traveling distance” of each crime involves the buffer zone. In the second fraction, you
subtract
the distance from 2B, where B is a number that will be chosen to describe the size of the buffer zone, and you use that subtraction result in the second fraction. The subtraction produces
smaller
answers as the distance increases, so that after raising those answers to another power,
g
, in the denominator of the second part of the formula, you get
larger
results.
Together, the first and second parts of the formula perform a sort of “balancing act,” expressing the fact that as you move away from the criminal's base, the probability of crimes first
increases
(as you move through the buffer zone) and then
decreases
. The two parts of the formula are combined using a fancy mathematical notation, the Greek letter ? standing for “sum (add up) the contributions from each of the crimes to the evaluation of the probability for the â
ij
' grid square.” The Greek letter ? is used in the two parts as a way of placing more “weight” on one part or the other. A larger choice of ? puts more weight on the phenomenon of “decreasing probability as distance increases,” whereas a smaller ? emphasizes the effect of the buffer zone.
Once the formula is used to calculate the probabilities, p
ij
, of all of the little squares in the grid, it's easy to make a hot zone map. You just color the squares, with the highest probabilities bright yellow, slightly smaller probabilities orange, then red, and so on, leaving the squares with low probability uncolored.