Understanding Business Accounting For Dummies, 2nd Edition (29 page)
Read Understanding Business Accounting For Dummies, 2nd Edition Online
Authors: Colin Barrow,John A. Tracy
Tags: #Finance, #Business

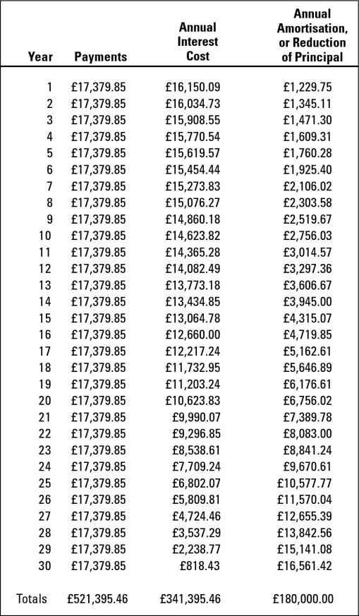
Figure 4-1:
Annual summary for a 30-year home mortgage repayment schedule.


Tools of the trade
We advise everyone to invest the time and effort (plus a relatively small cost) in learning how to use one of two indispensable tools of the trade for analysing savings and investments: a hand-held business/financial calculator and a personal computer spreadsheet program, such as Excel, Quattro Pro, or Lotus 1-2-3.
A powerful business/financial hand-held calculator costs under £50. You have to take some time and go through a few examples to learn how to operate the thing, but we think the time is well spent. The owner's manuals for the Hewlett Packard business/financial calculators are very well written and have good practical examples.
If you already use a computer spreadsheet program, take advantage of its financial functions. For example, you can easily print out loan repayment schedules, savings plans, pension fund accumulations, estimated retirement income, and many more useful tables and schedules and convert these into charts for easier viewing. The spreadsheet owner's manuals are terrible, we know. We suggest buying the
For Dummies
book for the spreadsheet program you use.

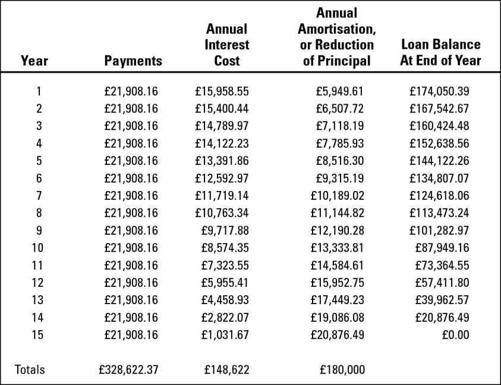
Figure 4-1A:
Annual summary for a 15-year home mortgage repayment schedule.
You may be tempted to focus on the amount of the monthly payment and how this amount fits into your personal budget. But you should also look closely at the pattern of interest versus capital payments over the life of the loan. In our experience, overlooking interest versus capital payments is the biggest mistake borrowers make. You should always know how fast you're paying off capital, and you should keep track of your loan balance.
Individuals as savers
Ben Franklin said, ‘A penny saved is a penny earned.' His point is that one penny not spent today is a penny kept for another day. Until that later day arrives, the penny saved can earn interest income. These days, 100 pennies saved for one year earn about 6 pennies in interest income, or 6 per cent per year.
Saving
is done for income and safety of capital and not for market value appreciation. Suppose you save £10,000 for one year. You expect to earn the going interest rate,
and
you expect to have little or no risk of losing any of your money during the year. You do not expect your savings to appreciate in value other than from interest income. Assuming that the going interest rate is 6 per cent, you expect that your savings will grow to £10,600 by the end of the year - the £10,000 you started with plus 6 per cent interest (or £6 per £100) earned on that money. The interest income increases your taxable income by the same amount, so keep in mind the marginal income tax rate that takes a bite out of your £600 in interest income.
The power of compounding (which means notspending your interest income)
Suppose you have some money that you want to save. You can deposit your money in a savings account at a building society or a bank. Or you can buy a government gilt stock, which is the way governments finance their borrowings. Or you can put your money in a money market fund. You can save money through many different types of vehicles and instruments, which are explained in Eric Tyson's excellent book
Personal Finance For Dummies
(John Wiley & Sons, Ltd). Our purpose is to demonstrate how your savings grow, or do not grow, depending on what you do with the interest income each period.
Suppose you have £100,000 in savings. (Larger amounts of money are more interesting than smaller amounts.) You leave the money alone for one year, and at the end of the year your savings balance has grown to £106,000. Therefore, you earned a 6 per cent annual interest income:
£6,000 increase in savings balance ÷ £100,000 balance at start of year = 6%
Now you have a critical choice to make: Should you withdraw the £6,000 income and spend the money, or should you leave the £6,000 in savings? Many people depend on income from their savings for living expenses. Others want to build up their money over time. Suppose you're in the second group; you leave the first year's interest income in your savings account for a second year.
At the end of the second year your savings amount is £112,360 - £6,360 more than at the start of the year. Therefore, for the second year, you also earned a 6 per cent annual interest rate:
£6,360 increase in savings balance ÷ £106,000 balance at start of year = 6%
You earned more interest income in the second year because you had more in savings at the start of the year. Notice that at the end of the second year you have two years of interest income accumulated: £6,000 from year one and £6,360 from year two, making a total increase of £12,360 in your savings amount.
If you continue to plough back annual earnings for 12 years, how much would you have at the end of the 12 years - starting with £100,000, earning 6 per cent per year, and resaving interest income every year? Without touching a calculator, we know that your savings balance after 12 years would about double, or would be £200,000. This quick-and-dirty method is based on the
rule of 72
(see the sidebar ‘The rule of 72'). To be more precise, your savings balance at the end of 12 years would be £201,220. We did this computation with a calculator. (If you use Microsoft Excel, you might double-check this amount by using the FV financial function; or you can go to a Web site that has a financial calculator.)
Note:
We use the terms
plough back
and
resaving
in order to avoid the term
reinvesting
. Reinvesting implies an investment, which, strictly speaking, involves market value fluctuation risk. Saving does not involve this risk. (We should warn you that there is always a small risk that part of the money in a savings account or fund will be lost or will be delayed in being returned to you - witness the recent Equitable Life situation in which pension funds lost considerable value.)

