The 30 Day MBA (11 page)
Authors: Colin Barrow

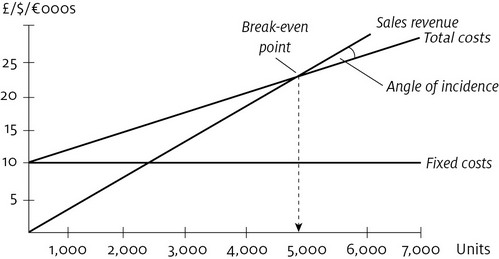
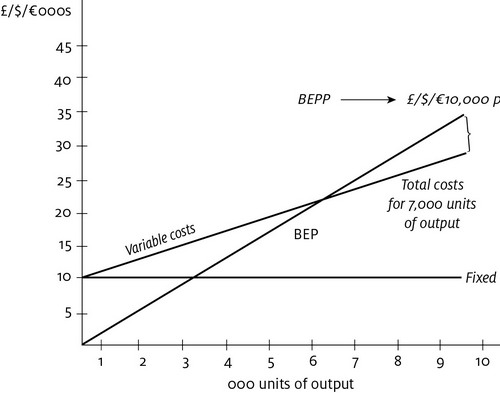
Figure 1.5
shows the break-even point (BEP). Perhaps the most important single calculation in the whole costing exercise is to find the point at which real profits start to be made. The point where the sales revenue line crosses the total costs line is the break-even point. It is only after that point has been reached that a business can start to make a profit. We can work this out by drawing a graph, such as the example in the figure, or by using a simple formula. The advantage of using the formula as well is that you can experiment by changing the values of some of the elements in the model quickly.
FIGURE 1.5
 Â
Cost model showing break-even point
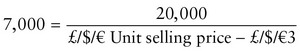
The equation for the BEP is:
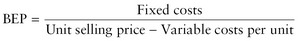
This is quite logical. Before you can reach profits you must pay for the variable costs. This is done by deducting those costs from the unit selling price. What is left (usually called the unit contribution) is available to meet the fixed costs. Once enough units have been sold to meet these fixed costs, the BEP has been reached. Let's try the sum out, given the following information shown on the break-even chart:

Now we can see that 5,000 units must be sold at £/$/â¬5 each before we can start to make a profit. We can also see that if 7,000 is our maximum output we have only 2,000 units available to make our required profit target. Obviously, the more units we have available for sale (ie the maximum output that can realistically be sold) after our break-even point, the better. The relationship between total sales and the break-even point is called the margin of safety.
Margin of safety
This is usually expressed as a percentage and can be calculated as shown in
Table 1.13
. Clearly, the lower this percentage, the lower the business's capacity for generating profits. A low margin of safety might signal the need to rethink fixed costs, selling price or the maximum output of the business. The angle formed at the BEP between the sales revenue line and the total costs line is called the angle of incidence. The size of the angle shows the rate at which profit is made after the break-even point. A large angle means a high rate of profit per unit sold after the BEP.
TABLE 1.13
 Â
Calculating a margin of safety
£/$/⬠| ||
Total sales | 35,000 | (7,000 units à £/$/â¬5 selling price) |
Minus break-even point | 25,000 | (5,000 units à £/$/â¬5 selling price) |
Margin of safety | 10,000 | |
Margin of safety as a percentage of sales | 29% | (10,000 ÷ 35,000) |
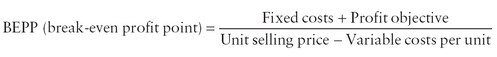
Meeting profit objectives
By adding in the final element, desired profits, we can have a comprehensive model to help us with costing and pricing decisions. Supposing in the previous example we knew that we had to make £/$/â¬10,000 profit to achieve a satisfactory return on the capital invested in the business, we could amend our BEP formula to take account of this objective:
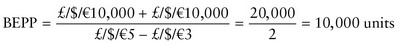
Putting some figures from our last example into this equation, and choosing £/$/â¬10,000 as our profit objective, we can see how it works. Unfortunately, without further investment in fixed costs, the maximum output in our example is only 7,000 units, so unless we change something the profit objective will not be met.
The great strength of this model is that each element can be changed in turn, on an experimental basis, to arrive at a satisfactory and achievable result. Let us return to this example. We could start our experimenting by seeing what the selling price would have to be to meet our profit objective. In this case we leave the selling price as the unknown, but we have to decide the BEP in advance (you cannot solve a single equation with more than one unknown). It would not be unreasonable to say that we would be prepared to sell our total output to meet the profit objective. So the equation now works out as follows:
Moving the unknown over to the left-hand side of the equation we get:
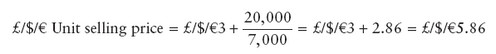
We now know that with a maximum capacity of 7,000 units and a profit objective of £/$/â¬10,000, we have to sell at £/$/â¬5.86 per unit. Now if the market will stand that price, then this is a satisfactory result. If it will not, then we are back to experimenting with the other variables. We must find ways of decreasing the fixed or variable costs, or increasing the output of the plant, by an amount sufficient to meet our profit objective.
Negotiating special deals
Managers are frequently laid open to the temptation of taking a particularly big order at a âcut-throat' price and it is the MBA's role to make sure that however attractive the proposition may look at first glance, certain conditions must be met before the order can be safely accepted. Let us look at an example â a slight variation on the last one. Your company has a maximum output of 10,000 units, without any major investment in fixed costs. At present you are just not prepared to invest more money until the business has proved itself. The background information is:
Maximum output | 10,000 units |
Output to meet profit objective | 7,000 units |
Selling price | £/$/â¬5.86 |
Fixed costs | £/$/â¬10,000 |
Unit variable cost | £/$/â¬3.00 |
Profitability objective | £/$/â¬10,000 |
The break-even chart will look like
Figure 1.6
.
FIGURE 1.6
 Â
Break-even chart for special deals
The managers you are advising are fairly confident that they can sell 7,000 units at £/$/â¬5.86 each, but that still leaves 3,000 units unsold â should they decide to produce them. Out of the blue an enquiry comes in for about 3,000 units, but a strong hint is given that nothing less than a 33 per cent discount will clinch the deal. What should you recommend? Using the costing information assembled so far, you can show the present breakdown of costs and arrive at your selling price.