The Crash Course: The Unsustainable Future of Our Economy, Energy, and Environment (23 page)
Read The Crash Course: The Unsustainable Future of Our Economy, Energy, and Environment Online
Authors: Chris Martenson
Tags: #General, #Economic Conditions, #Business & Economics, #Economics, #Development, #Forecasting, #Sustainable Development, #Economic Development, #Economic Forecasting - United States, #United States, #Sustainable Development - United States, #Economic Forecasting, #United States - Economic Conditions - 2009

Aside from the way that oil works tirelessly in the background to make our lives easy beyond historical measure, oil is a miracle in other ways. In the industrial processes, oil is the primary input feedstock to innumerable necessities of life, such as fertilizer, plastics, paint, synthetic fibers, countless chemical processes, and airplane rides. When we consider other potential fuel sources, we find that they are mostly incapable of fulfilling these needs.
It could be said that we all live like kings, but truthfully, even the wealthiest king of times past couldn’t click on a link, order an item made halfway around the world, and have it in his hands the next day. That ability is something the ancient Greeks would have recognized as the power of a god, and so it is.
1
While there are a number of potentially exciting new technologies and energy sources in the labs and even in pilot demonstrations—including cellulosic ethanol, methanol, and algal biofuels—I set a high bar; in order to be included in this book, they actually had to be in commercial production at a level that cracked the 1 percent-of-total-fuel barrier.
Why? Simply because if Peak Oil is only 5 or even 10 years from the writing of this book, any technology that has less than a 1 percent market share already, no matter how promising, is exceedingly unlikely to allow our economy to continue along uninterrupted.
And that’s the main point of this book: To illustrate why the next 20 years are going to be completely unlike the last 20 years.
Yes, I will be quite excited by and will closely follow the developments of new energy technologies. But no, I will not be staking a significant portion of my future strategy on the mere hope that these will arrive in time. Hope alone is a terrible strategy.
This book is meant to inject a dose of numerical reality back into the discussion, and that’s what I am driving at here. In order to be considered as a potential solution, the technologies and/or processes in question have to have a solid chance of affecting the outcome.
CHAPTER 16
Peak Oil
If you glance up from this book and scan your surroundings, you’ll be challenged to spy a single object that did not somehow, in some way, get there because of oil. In our economic model, petroleum fuels are involved in every step of the economy. Most things that are manufactured involve oil somewhere along the way, and quite a few are made directly from oil. Remember, you yourself are powered by food that is produced and delivered by oil! So even if you’re looking at an object created by nature that you personally collected and placed on a shelf in your home, we can still claim that it got there because of oil. Even intangible services are fueled by petroleum, as the people offering them are fed, clothed, transported, and kept comfortable by oil.
If you haven’t yet heard of Peak Oil, this chapter is going to be a real eye-opener. My purpose here is not to recreate a complete treatise on Peak Oil—that would take an entire set of books, and they’ve already been written by others
1
—but to establish just enough logical facts that we can tie the three Es together and arrive at the conclusion that prudent adults should seriously consider the implications and take specific steps in order to mitigate risks.
As we discussed in Chapter 15 (
Energy and the Economy
), energy is the lifeblood of any economy (or any complex system, for that matter). Without energy constantly flowing through that system, order and complexity will shrink as the system inexorably winds down and becomes disordered. (“Entropy” is the name given to this process by scientists). When an economic system has been built around exponentially driven debt-based money, the energy that fuels the exponential expansion of both debt and the economy deserves your very highest attention. Why? Because there’s a very high risk that a system that expands exponentially will also contract exponentially. As the old saying goes, what goes up must come down. The worry is that once its energy supports are knocked out, the economy will collapse at the same speed it expanded—
fast
.
Nothing is more important to the continuation of our current way of life than our ability to extract and deploy ever-larger amounts of energy. Our entire economic system is predicated upon the implicit assumption that the future will not only be larger than the past, but
exponentially
larger. This is a feature of our debt-based monetary system, where principal balances on nonproductive loans grow each year, leaving interest payments to provide the “exponential kicker.” Tomorrow’s economic growth is the collateral for today’s debts. If that growth does not occur, what then happens to the value of today’s debt?
Petro-Realities
In order to understand what “Peak Oil” means, we need to share a basic understanding about how oil fields work and how oil is extracted. A common misperception is that an oil rig is plunked down over an oil field, a hole is drilled, a pipe is inserted, and then oil gushes from a big underground lake or pool that eventually loses pressure and gets sucked dry. Let’s call this the “straw in a firmly gripped juice-box” model.
The reality is that what you find deep underground is pretty much the same thing you find when you dig a hole near the surface of the ground: solid material. No caverns, lakes, or pools; just solid earth.
So how do we find water and oil under the surface? Extractable liquids are only found in porous rocks, like sandstone, or fractured rocks that permit the oil or water to flow through extremely tiny crevices, fissures, and pores in between and around the granular structure of the rock. If you were to hold in your hand a chunk of rock from an oil-bearing formation, you’d perceive it to be a greasy but quite solid piece of rock. Therefore, it’s more accurate to think of an oil field like a frozen drink, not an underground juice box, where the oil is the tasty stuff and the rock is the crushed ice. We’ll call this the “frozen margarita” model (see
Figure 16.1
).
Figure 16.1
Juice-Box vs. Frozen Margarita Model

One of these more accurately represents an oil field. (Hint: It’s the one on the right.)
Sources:
Margarita image copyright Wacpan; juice-box image copyright Neiromobile.
Image:
Molly McLeod
When an oil field is tapped, we find that the amount of oil that comes out of it over time follows a tightly prescribed pattern that typically ends up resembling a bell curve. At first, when the frozen margarita is discovered upon the insertion of just one straw (the exploratory straw, as it were), the rate at which the beverage can be extracted is limited by having only one thin tube through which the drink can flow. As more and more straws are stuck into the delicious slush, more and more drink flows out of the reservoir at a higher and higher rate. But eventually the dreaded slurping sound begins, and then, no matter how many new straws are inserted and no matter how hard those straws are sucked, the amount of margarita coming out of the glass declines until it’s all gone and we’re left with only ice. That’s pretty much exactly how an oil field works.
So far, every single mature oil field has more or less exhibited the same basic extraction profile as the one caricatured in
Figure 16.2
. The amount of oil extracted over time grows higher and higher until it hits a peak, and then it progressively shrinks. Just like with a frozen margarita, once the oil is gone, it’s gone, and no amount of late-night wishing or desperate attempts at slurping will cause that circumstance to change. And what is true for one oil field is equally true when we measure across many oil fields and sum the result. Because individual fields peak, so do collections of fields.
Figure 16.2
Basic Extraction Profile

With each new straw, up to the first four, the rate of liquid extraction increases. After a time, the flow rate begins to decline and the insertion of straws #5 through #8 does not increase the flow rate.
Image
: Molly McLeod
Peak Oil, then, isn’t a theory, as some have tried to portray it; it’s an extremely well-characterized physical phenomenon. We have many decades of data and experience to draw upon when making that claim. This isn’t some idle theory that we’re waiting to confirm through additional observation. We know that literally thousands of individual oil finds have dwindled, because we’ve recorded every barrel coming from them over time; entire oil fields comprised of many smaller finds have depleted in front of our watchful eyes, and entire nations have undergone this process of peaking. We
can
theorize about how much oil remains to be discovered and produced, but the
process
by which oil fields become depleted is not up for debate. Peak Oil is not a theory; it’s an observed fact.
It’s Not “Running Out”
Far too often, Peak Oil is inaccurately described as “running out of oil,” as if we’ll produce more and more, and then, suddenly, we’ll just run out. This is incorrect. As described above Peak Oil involves producing slightly more and more until the peak, and then producing slightly less and less. In fact, given the difficulty in extracting the second half (which has to be carefully pumped out) in contrast to the first half, there’s usually a longer span of time to be found
after
the peak than
before
the peak. One way to think of the process is that at the moment of the peak, roughly half of the oil that was ever there remains to be extracted.
But something interesting happens at the halfway mark. Where oil gushed out under pressure at first, the oil represented by the back half of the curve (the down slope) usually has to be laboriously pumped or squeezed out of the ground at a higher cost, in terms of both energy and money, than before, when it gushed from the ground under pressure. Where every barrel of oil was cheaper to extract on the way up, the reverse is true on the way down; each barrel becomes more costly to extract in terms of time, money, and energy. Eventually it costs more to extract a barrel of oil than it’s worth, and that’s when an oil field is economically abandoned.
Figure 16.3
shows crude oil production in United States from 1900 to 2007. Starting with the first well drilled in 1859 in Titusville, Pennsylvania, more and more oil was progressively pumped from the ground until 1970 (“the peak”), and after that point, less and less came out of the ground. The massive finds in Alaska and the Gulf of Mexico could not overcome the rate of depletion in the lower 48 to achieve a new high water mark of oil production. The United States’ peak of oil production in 1970 was just under 10 million barrels a day, and 40 years later it produces just a little over 5 million barrels a day. So “Peak Oil” in the United States isn’t a theory, but a 40-year-old fact.
Figure 16.3
U.S. Crude Oil Production, 1900 to 2007
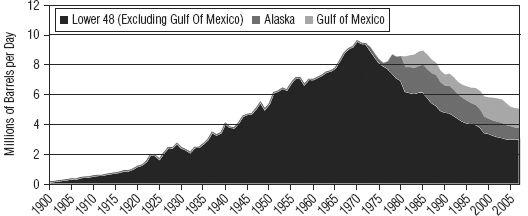
Broken out by major region.
Source:
Energy Information Administration.
In
Figure 16.3
, you will notice that the data for the lower 48 is a very close match to the idealized depletion curve in
Figure 16.2
, but adding the new fields from the other areas serves to create a sort of “bumpy plateau” between 1970 and 1985.
So what we see for the United States is a nearly textbook-perfect example of Peak Oil: a steady rise in oil production to a peak, followed by a steady decline in oil production. Out of 54 oil-producing countries in the world, 40 are now past peak and in decline, leaving only 14 to try to both cover the declines occurring in other areas and add more oil to fuel to the story of growth.
2
Again, these aren’t theories, but facts.
The United States consumes far more oil than it produces and by necessity imports two-thirds of its daily needs. Japan, lacking any domestic oil source, imports nearly 100 percent of the petroleum that it needs. The United Kingdom, having gone past peak in the incredibly productive North Sea fields in 1998 (which now produce less than half as much as their peak amount) became a net importer of both natural gas and petroleum in 2004 and 2005, respectively.
3
Australia’s oil hit peak in 2000, and by 2009 Australia was importing close to 40 percent of its petroleum needs.
4