The Crash Course: The Unsustainable Future of Our Economy, Energy, and Environment (21 page)
Read The Crash Course: The Unsustainable Future of Our Economy, Energy, and Environment Online
Authors: Chris Martenson
Tags: #General, #Economic Conditions, #Business & Economics, #Economics, #Development, #Forecasting, #Sustainable Development, #Economic Development, #Economic Forecasting - United States, #United States, #Sustainable Development - United States, #Economic Forecasting, #United States - Economic Conditions - 2009

Just as food energy is vital to the effective functioning of our bodies, which are very complex machines, energy that can perform work is absolutely vital to the creation and maintenance of complex economies. The key word here is “work.” Without energy, no work could ever be accomplished, but not all forms of energy are useful for doing work. The tiny amount of potential energy stored up in the spring of a wristwatch can perform the useful work of moving the watch’s hands and mechanisms, but the enormous heat energy contained in one of the Great Lakes can do almost no work, because it isn’t concentrated enough to be of any practical use.
The more energy density something contains, the more useful it is. This is why the fossil fuels—oil, natural gas, and coal—are so desired and desirable. They represent concentrated forms of energy that are capable of doing a lot of work. Without them, our economy would be a pale shadow of its current bright self. Given the importance of energy to the continued smooth functioning of our economy, we owe it to ourselves to understand the ideas and the data that underlie the sources and amounts of energy that course through our economic arteries.
Energy Budgeting
To help us on this journey, let’s take a quick tour through the concept of energy budgeting. If you have a household budget or have ever run the numbers for a business, this will be an easy topic.
Imagine that at any given time there is a defined amount of energy available for us to use as we wish. This will be our budget to spend as we see fit, but instead of dollars, this budget will consist of units of energy. Let’s put every source of currently existing energy into this budget: solar, wind, hydro, nuclear, coal, petroleum, natural gas, biomass, and so on.
This list represents our total energy to use any way we please; it’s our “energy budget.” Our first mandatory expenditure from this budget will be the energy that we need to use in order to ensure that we’ll have more energy next year. Consider it an unavoidable energy tax. A certain amount of energy must be used to maintain our existing energy infrastructure—all the dams, pipes, and power plants—and an additional amount must be expended to find more energy to replace that which we use up. Along with this, we must also invest some energy in building and maintaining the capital structure that allows us to collect and distribute energy and maintain a complex society. Things like roads, bridges, electrical grids, and even our buildings go into this category. Together, all of this can be considered our mandatory energy expenditures, meaning that they are unavoidable.
Once we’ve subtracted all of the mandatory energy expenditures from our budget, the remaining energy can be used for consumption. Part of this must go toward procuring our basic living needs, such as water, food, and shelter, leaving the rest for truly discretionary things like vacation trips to the Galapagos, selling hula hoops to Eskimos, and attending concerts. All of this has been diagrammed in
Figure 15.1
.
Figure 15.1
Energy Budgeting
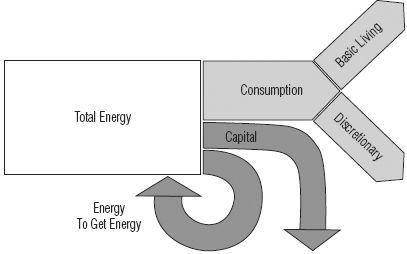
In this energy budget, a certain amount must be reinvested (darkest arrows), leaving the rest to be consumed by basic living and fully discretionary uses.
Image:
Jeanine Dargis
To further simplify this story, we can divide energy up into two big buckets: (1) energy that must be reinvested to maintain existing energy flows, buildings, and basic living needs (“mandatory”), and (2) energy that we can more or less choose what to do with (“discretionary”). Using our prior terminology, the discretionary bucket becomes the surplus energy that we can either apply toward growth
or
prosperity, but not both (unless there is surplus). But our surplus energy is shrinking, for two reasons: Every year there are more people placing more “mandatory” demands on the energy we have, and every year we’re getting less and less energy back from our energy investments.
Net Energy
This is the most important concept of this chapter and one of the most important concepts of the book. I want you to ignore how much energy costs in money terms, because the cost is actually irrelevant (especially when your money is printed out of thin air). Instead, I want you to focus on
how much energy it takes to get energy,
because, as I’m going to show you, this is even more important to our current and future well-being than the raw amount of energy that we can produce each year. The concept is straightforward, and it’s called “net energy.”
Because it takes energy to both find and produce energy, we’re going to look at the returns delivered from energy exploration and production activities in terms of the ratio between what is invested and what is returned. Imagine that the total energy it took to find and drill an oil well were one barrel of oil, and that one hundred barrels came to market as a result. We’d say that our net energy return was “one hundred barrels to one,” or 100:1. In this example, our mandatory expenditure was 1 out of 100, or 1 percent. Another phrase for this that you’re likely to encounter in the literature is Energy Returned on Energy Invested, which goes by the acronym EROEI.
I find this easier to visualize in graphical form:
In
Figure 15.2
, we’re comparing the relationship between energy out and energy in. The black part (above) is the amount of energy we put in (“invested”), and the gray part (below) is how much energy we got out (“returned”), representing the net energy that’s available for us to use for whatever purposes we desire. All the way to the left of the chart, the energy out divided by energy in yields a value of 50, meaning that 1 unit of energy was used to find and produce 50 units of energy. In other words, 2 percent was used to find and produce energy, leaving us a net 98 percent in the gray part to use however we see fit. This represents the surplus energy available to society; it’s the stuff that we use to create the order and complexity that we see all around us. As we scan across the chart, we can observe that the surplus energy available to society remains quite high all the way down to a net energy ratio of about 10, where it suddenly falls off a cliff. We might also note that this is yet another nonlinear chart in our lives.
Figure 15.2
The Energy Cliff
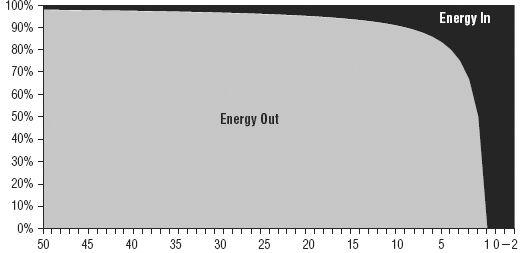
This figure expresses the relationship between energy invested and energy returned. Note that together the invested and returned energy always sum to 100 percent and the lines hit zero percent at a reading of “1” where it takes one unit to find one unit for a zero percent return.
Now I want to draw your attention to what happens on part of the chart between the readings of 10 and 5. The net energy available to society begins to drop off quite steeply and nonlinearly. Below a reading of 5, the chart really heads down in earnest, hitting zero when it gets to a reading of 1, which is where it takes one unit of energy to get a unit of energy. At that boundary, there’s zero surplus energy available and there’s really no point in going through the trouble of getting it.
Given that energy is the master resource, and no economic activity is possible without energy, we all care very deeply how much energy is available. What
Figure 15.2
allows us to begin to appreciate is that it’s not “energy” we really care about, but net energy, the light gray part below, because that’s the area that literally makes possible almost everything that you care about. It allows the lights to come on, food to appear on your plate, warmth to fill your home, and the big brown truck of mail-order happiness to pull into your driveway.
To further explore why this is an enormously important chart, let’s take a look at our experience with net energy with respect to oil (
Figure 15.3
).
Figure 15.3
The Energy Cliff (2) and Oil
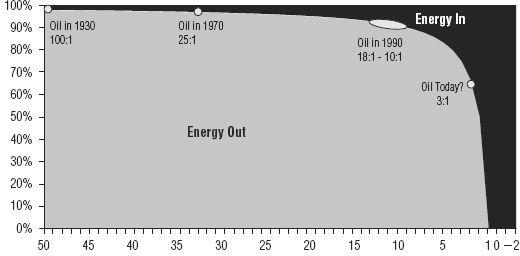
The energy returns of oil production over time have been declining.
Source:
C.J. Cleveland, “Net Energy from Oil and Gas Extraction in the United States.”
In 1930, for every barrel of oil used to find oil, it’s estimated that 100 were produced, giving us a reading of 100:1, which would be way off to the left in
Figure 15.3
. By 1970, fields were a lot smaller and the oil was often deeper or otherwise trickier to extract, so, unsurprisingly, the net energy gain fell to a value of around 25:1—still a very good return with lots of light gray beneath it. By the 1990s, this trend continued, with oil finds returning somewhere between 18:1 and 10:1.
7
It’s estimated that new oil resources found after the year 2010 will return a much lower net energy, perhaps as low as 3:1, although nobody really knows for sure because careful analyses have not yet been performed. Still, we might observe that gigantic rigs drilling through thousands and thousands of feet of water and rock as they chase after smaller and smaller fields will intuitively have less favorable energy returns than prior efforts located in shallower zones on dry land.
Why is the net yield dropping? In the past, a relatively tiny amount of embodied energy was contained within the smallish rigs that were used to exploit finds that were massive, plentiful, and relatively shallow. Two of the larger finds in the world’s history, Spindletop in Texas and the Ghawar field in Saudi Arabia, are both only a little over 1000 feet below the surface. The Macondo field in the Gulf of Mexico, which was the site of the Deepwater Horizon incident in 2010, was beneath 5,000 feet of water and a further 13,000 feet of rock and sediment, and held perhaps 1/1000th of the oil in Ghawar. All that drilling, miles of piping, and a massive oil rig were required to find a relatively minor amount of oil, illustrating why the net energy of oil discoveries of today are so much lower than the past. And the Macondo field was neither particularly deep nor disappointingly small by current standards.
Today much more energy is required to find energy. Exploration ships and rigs are massive, requiring significantly more steel to create than the humble drilling rigs of the 1930s. And today more wells are being drilled to greater depths in order to find and produce smaller and smaller fields, all of which weigh upon our final net energy return.